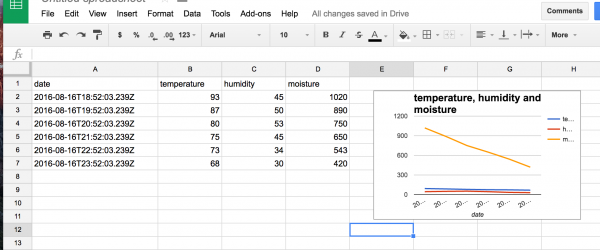
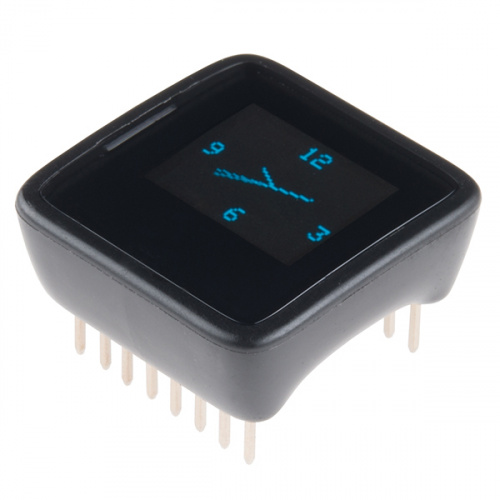
Introduction
The SparkFun MicroView is the first chip-size Arduino-compatible module that lets you see what your Arduino is thinking by using a built-in Organic Light-Emitting Diode (OLED) display. In the heart of MicroView, there is an ATMEL ATmega328P and a 64x48 pixel OLED display, together with other passive components that allow the MicroView to operate without any external components other than a power supply. It fits nicely into a breadboard to make prototyping easy. The MicroView also has a full-featured Arduino library to simplify programming the module.
Only 8 left!
DEV-12923
The MicroView is the first chip-sized Arduino compatible module that lets you see what your Arduino is thinking using a built…
34This guide will cover everything you need to know about the MicroView, including hardware information, quick-start experiments, library installation and usage, and advanced information such as making your own MicroView font.
Required Materials
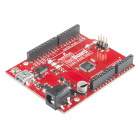
The MicroView is a stand-alone system. However, you will need an external programmer to upload new code to the MicroView. The MicroView USB programmer is sold separately, so you can purchase one programmer while purchasing as many MicroView modules as you need. If you do not have one already, you will need a MicroView USB programmer to follow along with this tutorial.
In stock
DEV-12924
The MicroView is the first chip-sized Arduino compatible module that lets you see what your Arduino is thinking using a built…
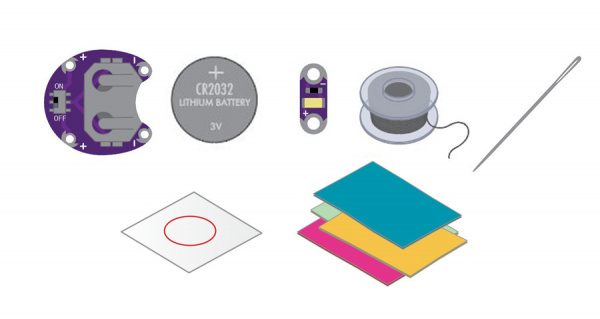
5In addition to the MicroView and the USB programmer, you will need a few basic electronic components. Here is a complete list of the parts used in this tutorial.
Note that the USB extension cord is not necessary; the MicroView USB programmer can plug directly into a USB port. However, your USB port may be difficult to access, may be too tightly spaced for the programmer, or may result in the MicroView appearing upside down to you. In these instances, the USB extension cable comes in very handy. We carry both a 1.5-foot version and a 6-foot version.
Suggested Reading
If you have never worked with the Arduino development environment before or need a refresher, you may find the following links useful.
Installing Arduino IDE
A step-by-step guide to installing and testing the Arduino software on Windows, Mac, and Linux.
MicroView Overview
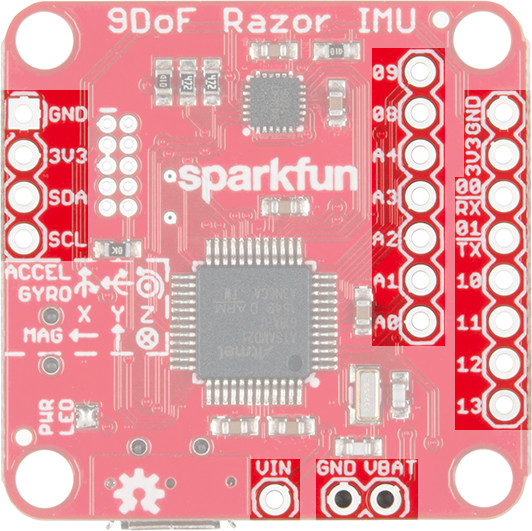
Let’s first familiarize ourselves with the MicroView and its pins. Below you’ll find a list of specifications as well as a graphical datasheet detailing the function(s) of each pin.
![microview]()
Hardware Specifications
- Input Voltage: 3.3VDC–16VDC
- Display: 64x48 OLED Display
- Microcontroller: ATmega328P
- Operating Voltage: 5V
- Digital I/O Pins: 12 (of which 3 provide PWM output)
- Analog Input Pins: 6
- Flash Memory: 32KB
- SRAM: 2KB
- EEPROM: 1KB
- Clock Speed: 16MHz
Pin Configuration
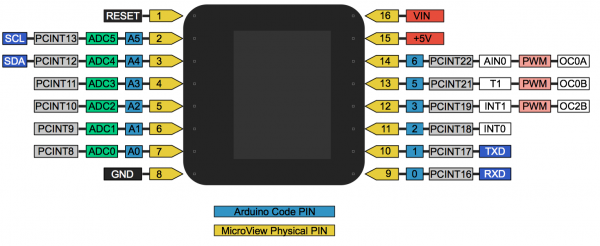
The MicroView has 16 “physical pins” that map to corresponding “Arduino pins” that can be referenced from within your Arduino sketch. For example, physical Pin 2 maps to the Arduino’s Analog Pin A5.
![pinout]()
Pinout of MicroView on its side. The top of the MicroView is on the right. (Click image for closer look.)
The pin numbering for the MicroView increments as you move counter-clockwise.
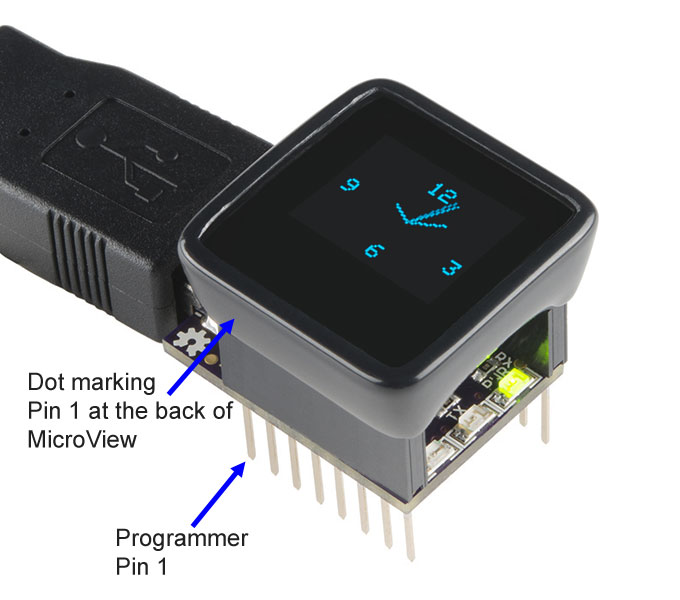
The MicroView’s physical Pin 1 is denoted by a dot on the underside of the MicroView.
![alt text]()
For more details on each pin’s function, please refer to the ATmega328P Datasheet.
Quick Start Tutorials
The MicroView comes with preinstalled code to get you learning right out of the box without having to do any programming. Using just a few components, you can learn the ins and outs of the MicroView.
Setting Up Your MicroView
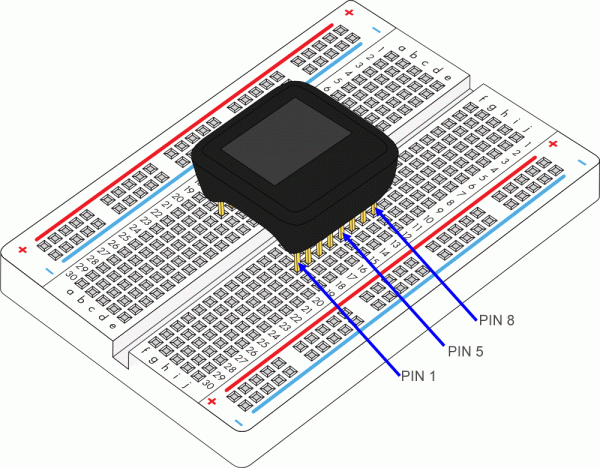
Identify Pin 1 of MicroView based on the following diagram, or refer back to the MicroView Overview section.
![alt text]()
In this guide, when there is a reference for Pin X of MicroView, it is referring to the above diagram’s pin number. For example, connect Pin 5 and Pin 8 of the MicroView.
First-Time Electronics Users
If this is your first time experimenting with electronics, you may want to read these other guides first.
How to Use a Breadboard
Welcome to the wonderful world of breadboards. Here we will learn what a breadboard is and how to use one to build your very first circuit.
Resistors
A tutorial on all things resistors. What is a resistor, how do they behave in parallel/series, decoding the resistor color codes, and resistor applications.
Light-Emitting Diodes (LEDs)
Learn the basics about LEDs as well as some more advanced topics to help you calculate requirements for projects containing many LEDs.
Polarity
An introduction to polarity in electronic components. Discover what polarity is, which parts have it, and how to identify it.
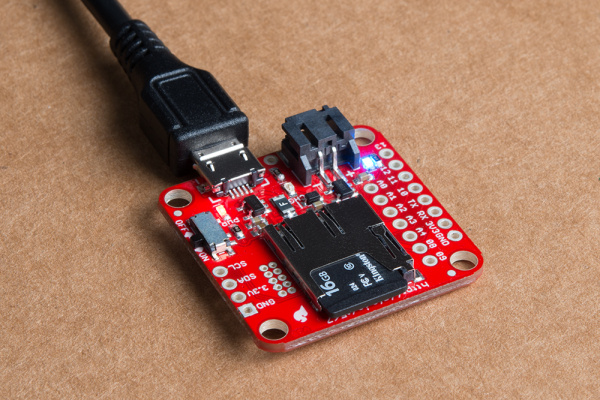
MicroView with USB Programmer
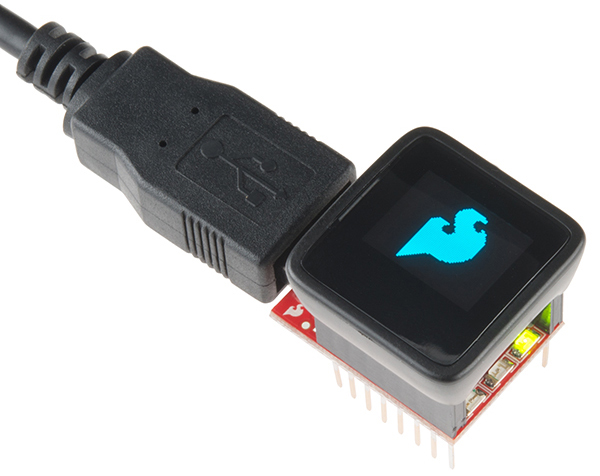
The quickest way to get started is to use the USB programmer.
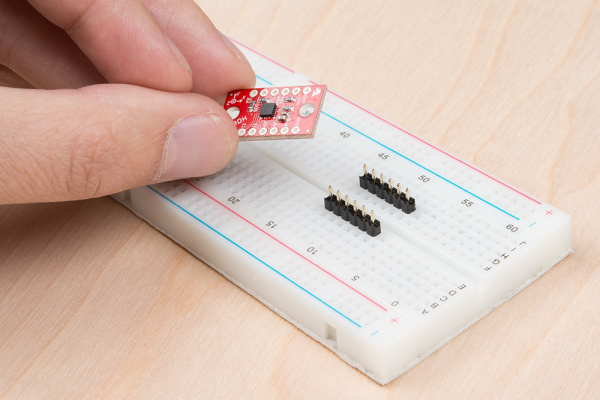
Insert the MicroView to the USB programmer. Then connect the female end of the USB extension cable to the factory USB programmer.
![alt text]()
Note that it is much easier to connect a USB extension cable if the MicroView is inserted into the end of the breadboard.
Connect the male end of the USB extension cable to the computer. The MicroView will power on, and the demo will start.
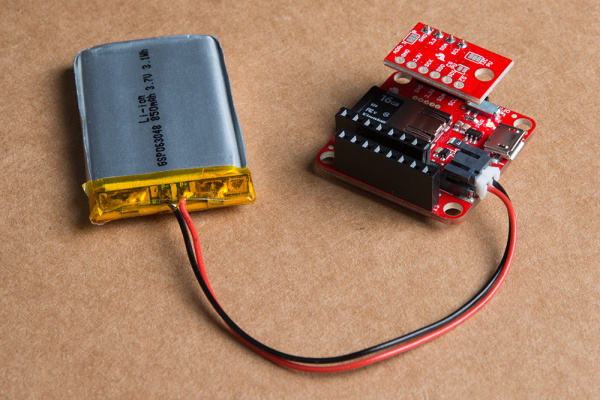
MicroView without USB Programmer
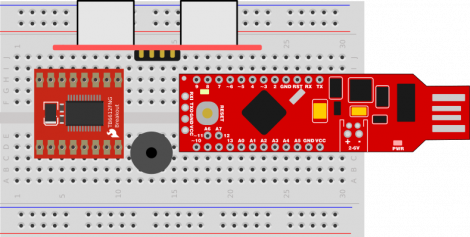
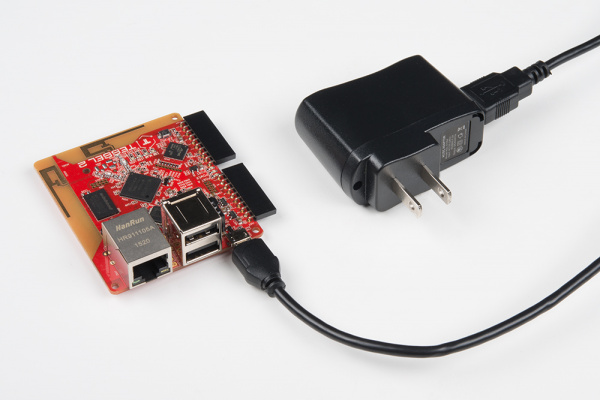
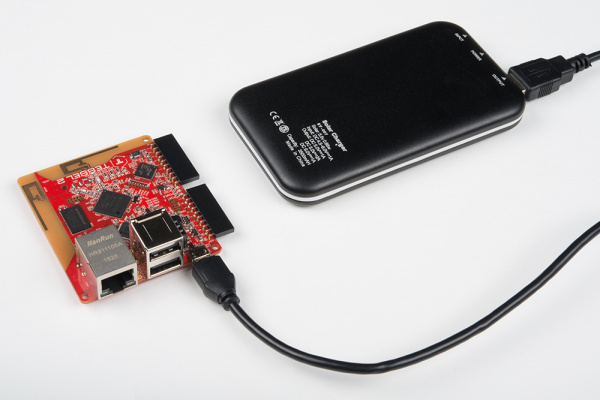
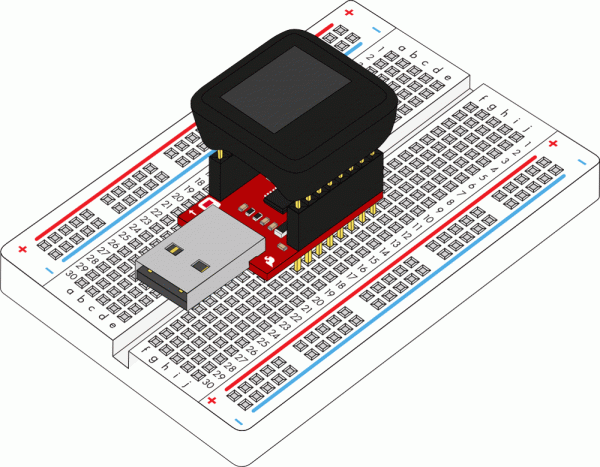
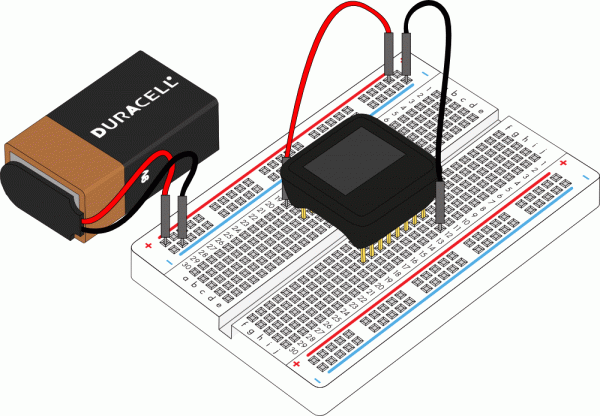
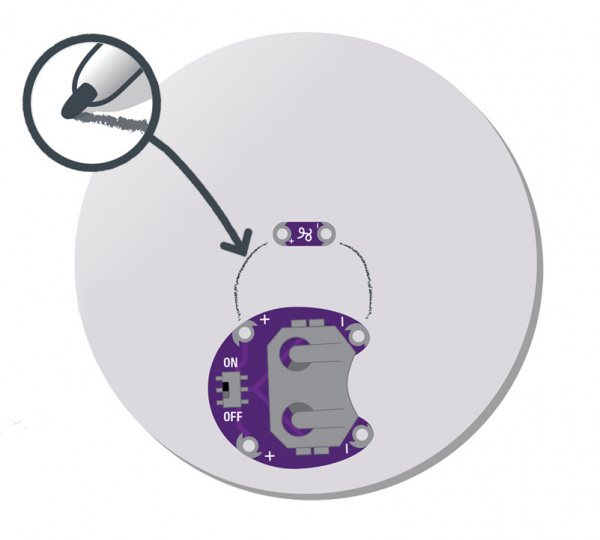
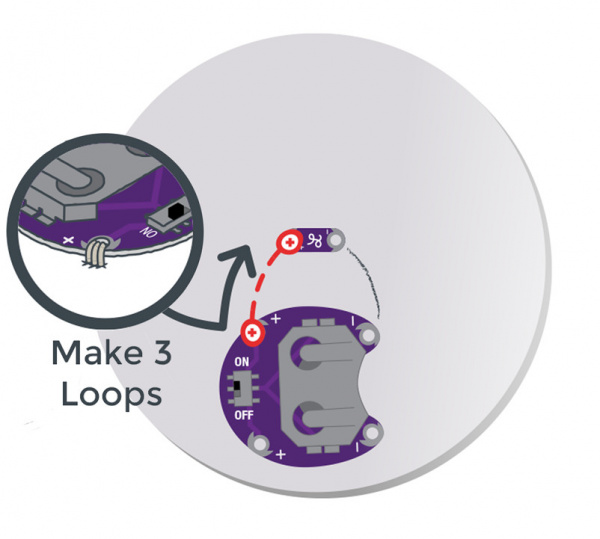
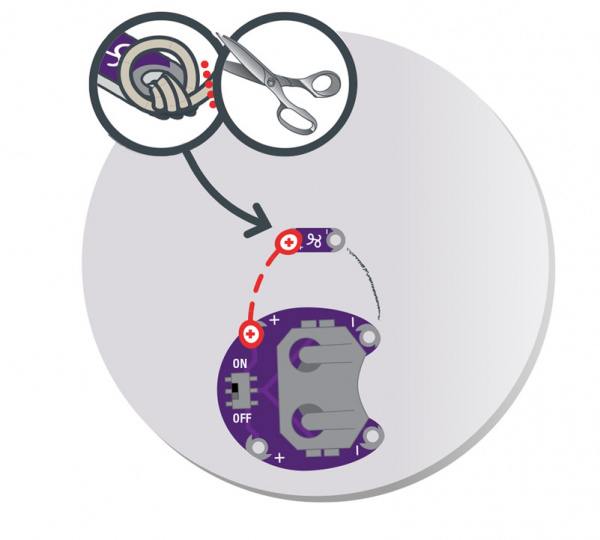
If you would like to use the MicroView without the USB Programmer, you will need the following (please note that the 9V battery and snap connector will need to be purchased separately):
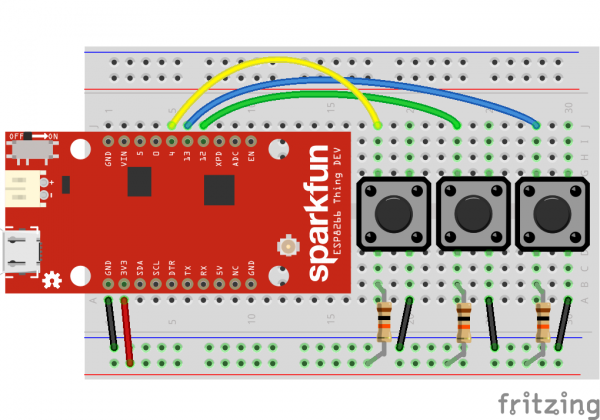
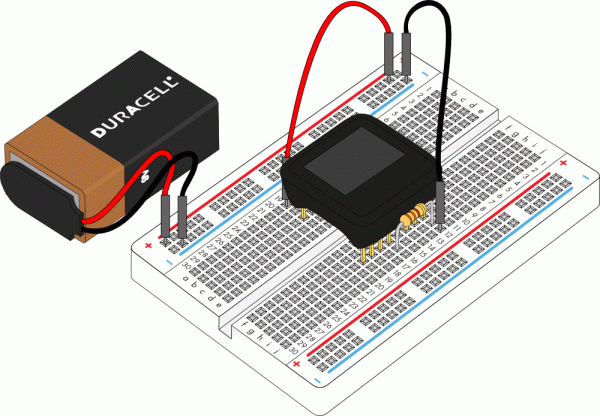
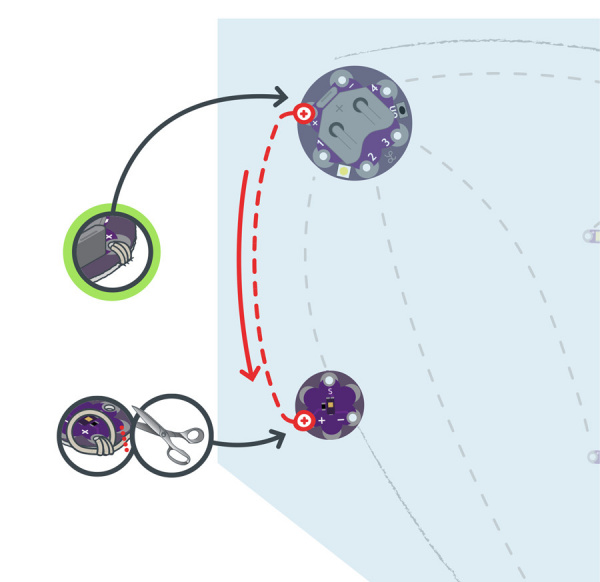
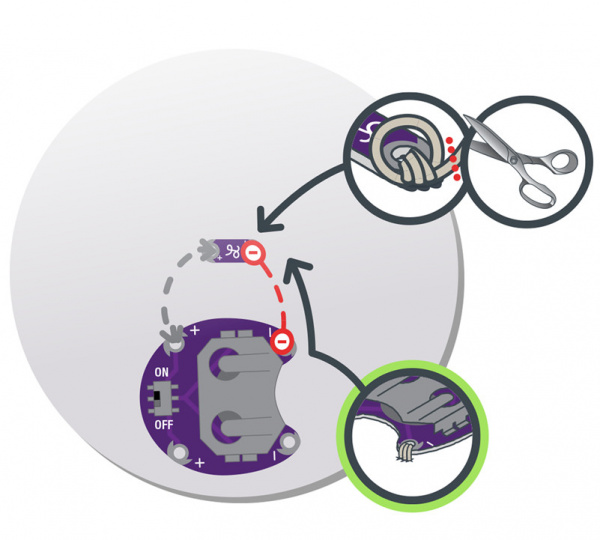
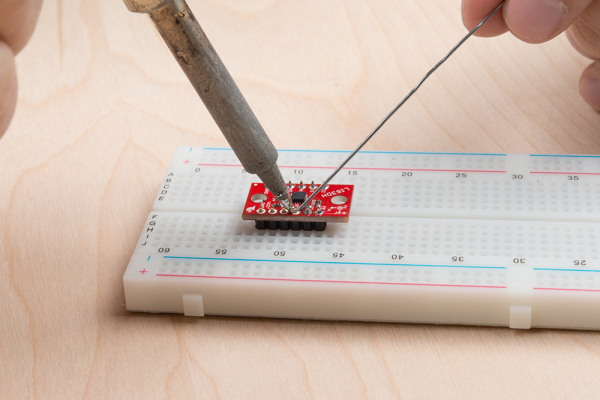
Connect the required parts based on the diagram below. Plug in the battery connectors last. Once plugged in, the 9V battery will power the MicroView through the VIN pin (PIN 1).
![alt text]()
As soon as the MicroView is powered, the demo will start.
Learn How to Use MicroView
The MicroView comes pre-programmed with a few simple built-in tutorials to help you get use to inserting jumper wires, resistors and an LED. Skip these tutorials if you are already familiar with them. They will begin after the visual demo.
Note: The following examples are based on MicroView without the USB Programmer, if you have the USB Programmer, please ignore the battery, red jumper and black jumper. The MicroView gets its power supply from the USB Programmer via the USB cable connected to the computer.
Simple Tutorial 1
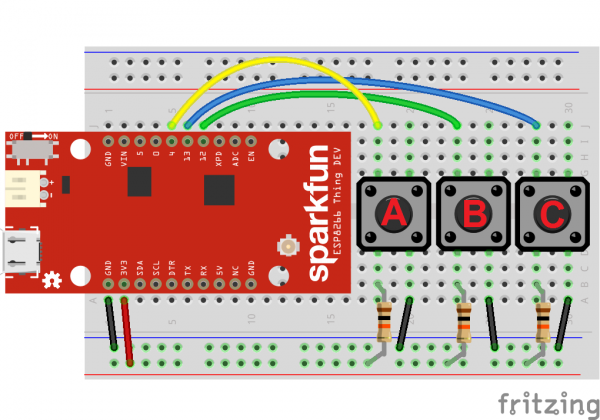
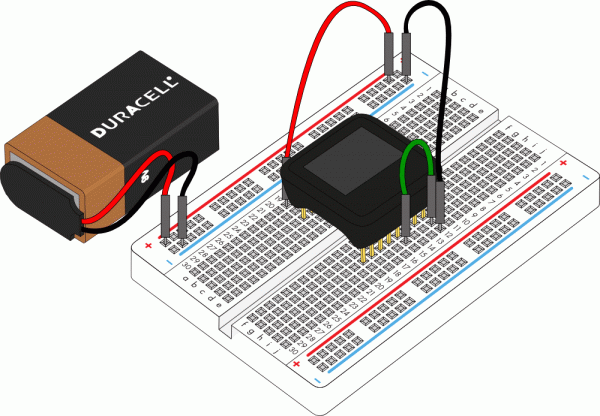
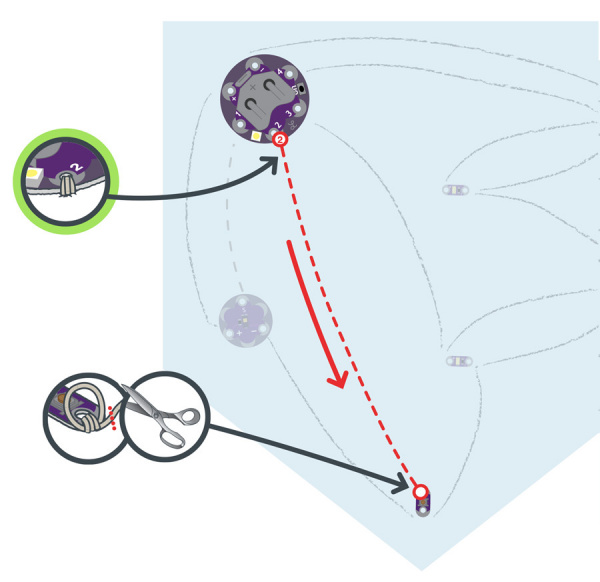
Follow the instruction displayed on the MicroView, and connect PIN 5 and PIN 8 of the MicroView with a jumper using the following diagram as reference:
![alt text]()
Once you have successfully connected PIN 5 and PIN 8 of the MicroView, a “Well done!” message will be displayed. To proceed to the next simple tutorial, remove the jumper.
Simple Tutorial 2
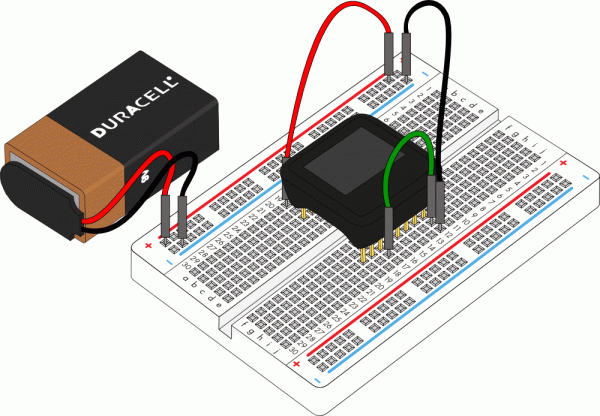
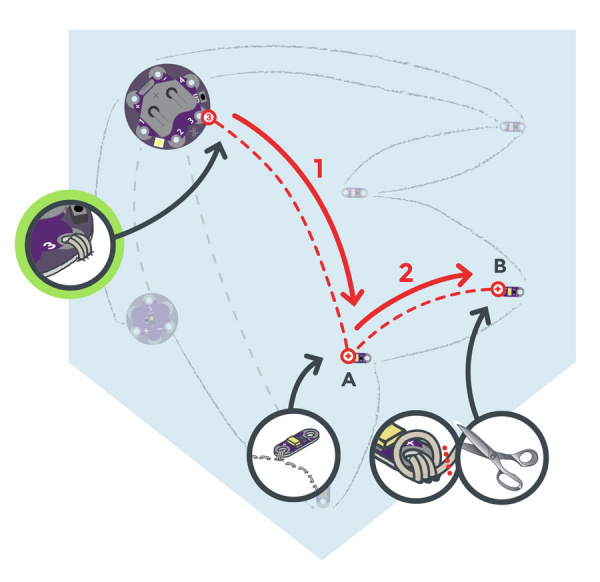
Follow the instruction displayed on the MicroView, and connect PIN 3 and PIN 8 of the MicroView with a jumper using the following diagram as reference:
![alt text]()
Once you have successfully connected PIN 3 and PIN 8 of the MicroView, a “Well done!” message will be displayed. To proceed to the next simple tutorial, remove the jumper.
Simple Tutorial 3
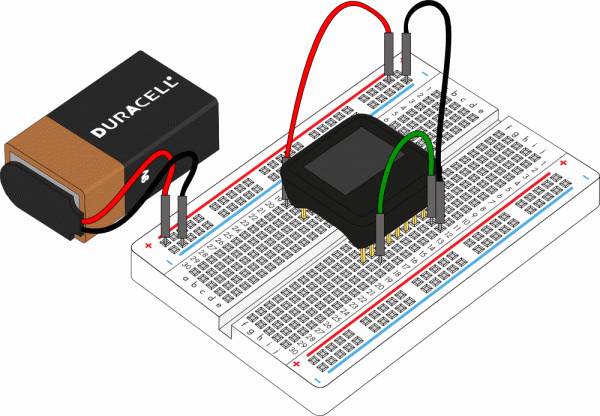
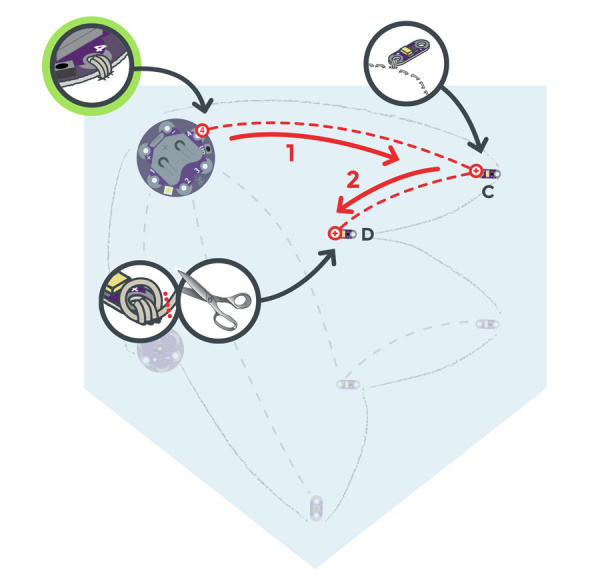
Follow the instruction displayed on the MicroView, and connect PIN 2 and PIN 8 of the MicroView with a jumper using the following diagram as reference:
![alt text]()
Once you have successfully connected PIN 2 and PIN 8 of the MicroView, a “Well done!” message will be displayed. To proceed to the next simple tutorial, remove the jumper.
Simple Tutorial 4
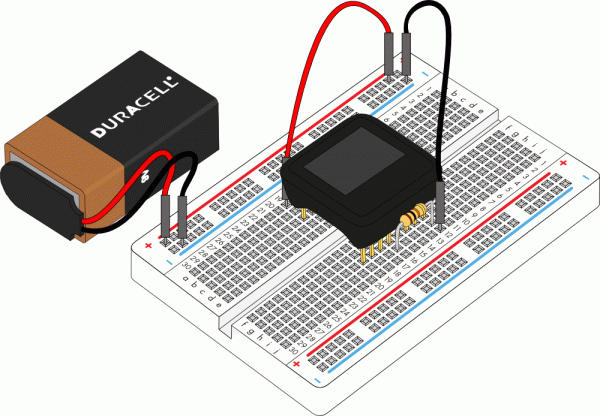
Follow the instruction displayed on the MicroView, and connect PIN 4 and PIN 8 of the MicroView with a 330Ω resistor using the following diagram as reference:
![alt text]()
Once you have successfully connected PIN 4 and PIN 8 of the MicroView with the resistor, a “Well done!” message will be displayed. To proceed to the next simple tutorial, remove the resistor.
Simple Tutorial 5
Follow the instruction displayed on the MicroView, and connect PIN 4 and PIN 8 of the MicroView with a 10KΩ resistor using the following diagram as reference:
![alt text]()
Once you have successfully connected PIN 4 and PIN 8 of the MicroView with the resistor, a “Well done!” message will be displayed. To proceed to the next simple tutorial, remove the resistor.
Simple Tutorial 6
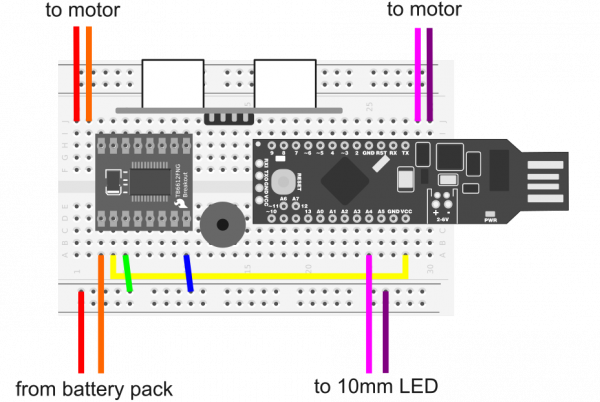
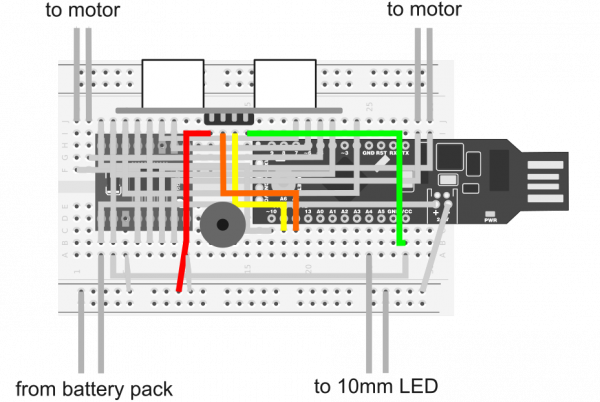
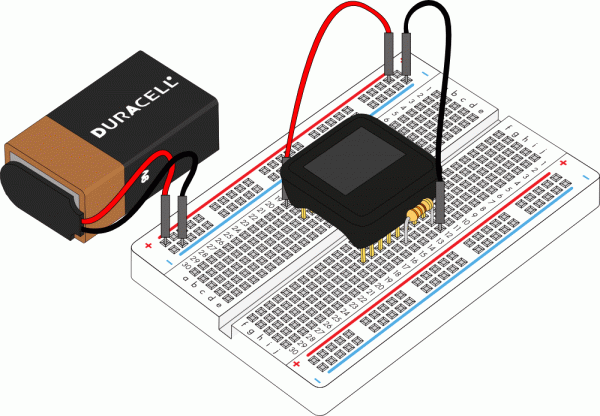
Follow the instruction displayed on the MicroView, connect PIN 5 and PIN 8 of the MicroView with a 330Ω resistor using the following diagram as reference:
![alt text]()
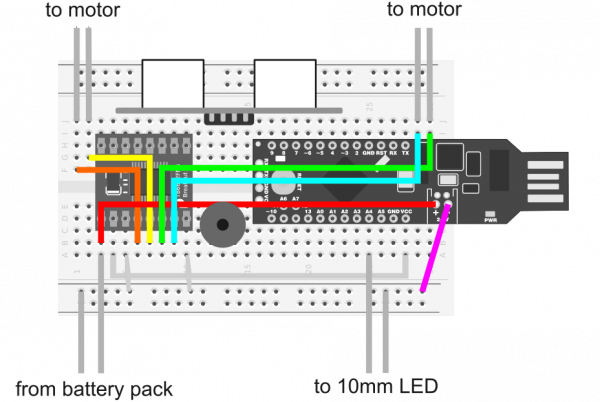
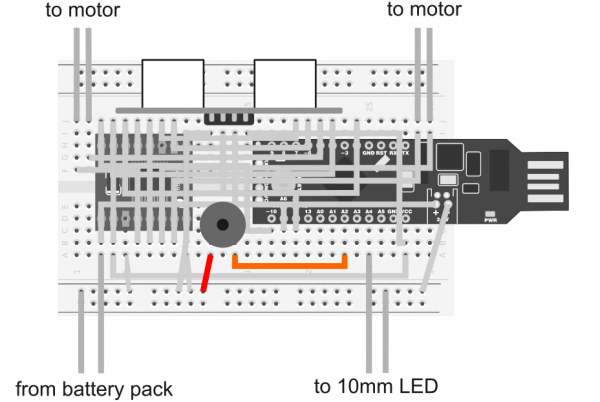
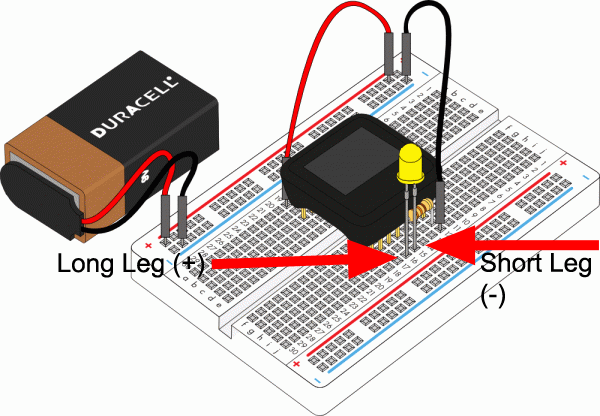
With the resistor still at the same place, insert an LED with both of the pins at PIN 4 and PIN 5 of MicroView respectively using the following diagram as reference.
![alt text]()
The MicroView is able to detect if the LED is inserted with the correct polarity, and it will begin blinking the LED.
If the LED does not blink, remove the LED and turn the pins the other way round and connect them to PIN 4 and PIN 5 of the MicroView.
With that, you are now ready to upload code and begin building the experiments in this guide.
If you would like to load the Demo Sketch back on to the MicroView after you have uploaded any other code, you can find the MicroViewDemo.ino sketch in the MicroView Library Examples.
![demo]()
MicroView Library Installation
The following section will cover all of the instructions to install the MicroView library and get started using the MicroView with the Arduino IDE.
In order to get your MicroView up and running, there a few easy steps you will need to follow:
- Download the FTDI drivers
- Install Arduino software and MicroView library
- Select the right board
- Run your first sketch
Driver Installation
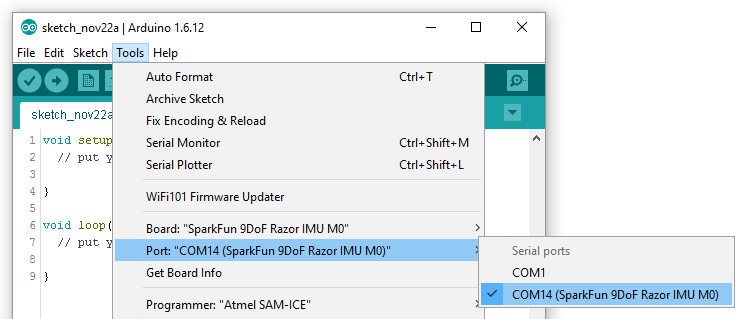
If you have never used an Arduino or Arduino-compatible device on your computer before, you’ll likely need to install the drivers for the FTDI chip located on the MicroView USB programmer board. If you have never installed an FTDI driver before, please visit our FTDI driver installation tutorial. Once successfully installed, your MicroView should show up as a valid COM port in the Arduino IDE under Tools -> Ports.
On a Mac or Linux machine, it will appear as /dev/cu.usbserialXXXXXX, where the X’s are some specific characters and numbers.
On Windows, it will appear as COMXX, where the X’s are a specific number.
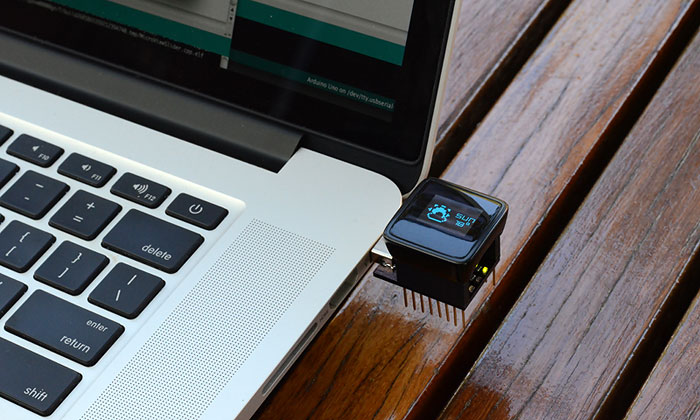
Once you have finished the FTDI driver installation, you will need to prepare your MicroView to be inserted into the computer’s USB port.
If you’re using the USB programmer, insert the MicroView into the USB programmer now. Be sure to align Pin 1 of the MicroView with Pin 1 of the USB programmer. Once you have inserted the MicroView into the USB programmer, you can insert the USB programmer into the USB port of the computer as pictured below. If your computer does not have a right-sided USB port, please use a USB Cable Extension to extend the USB port to the front so that you can easily work with the MicroView.
![alt text]()
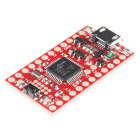
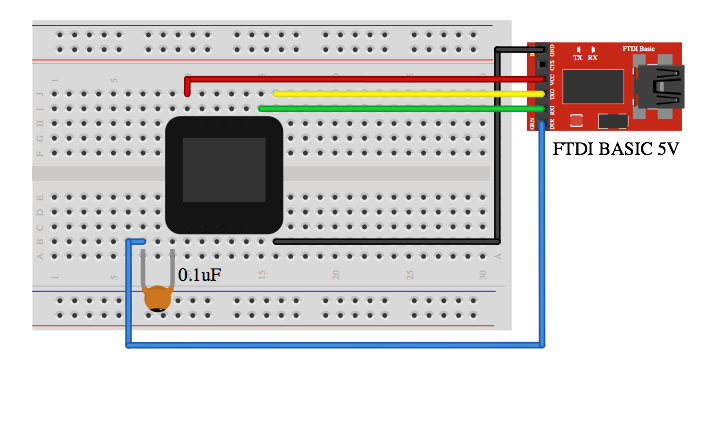
As an alternative to the USB programmer, you can use a 5V FTDI Basic breakout or 5V FTDI cable instead. Connect the FTDI Basic breakout board as shown below, and you are ready to go.
![alt text]()
Install Arduino IDE and the MicroView Library
If you have not installed the Arduino IDE already, now is the time to do so. Visit our Installing Arduino IDE tutorial for detailed instructions.
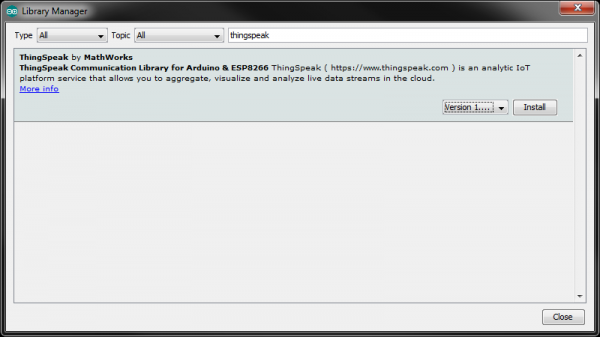
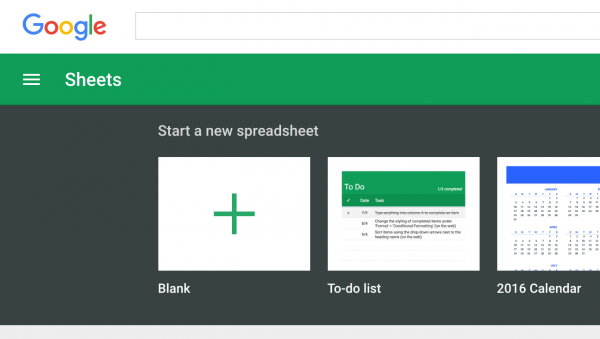
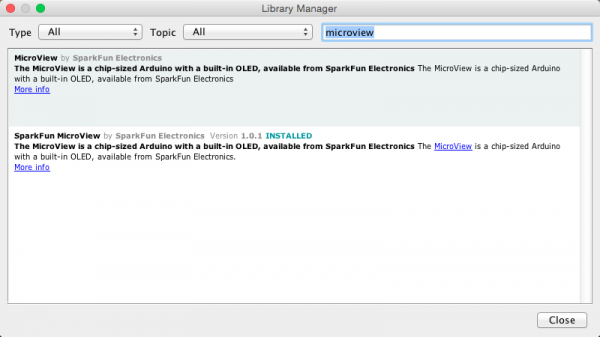
Download the library using the Arduino Library Manager (found in all versions of the Arduino IDE from v1.6.4 and on).
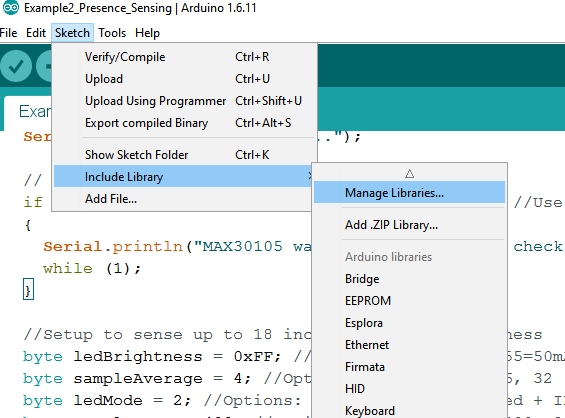
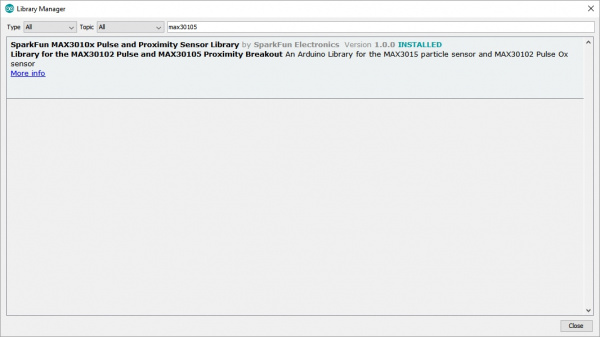
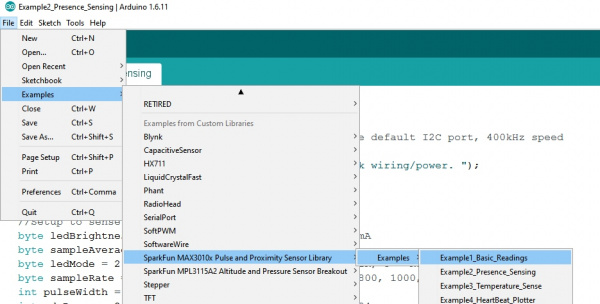
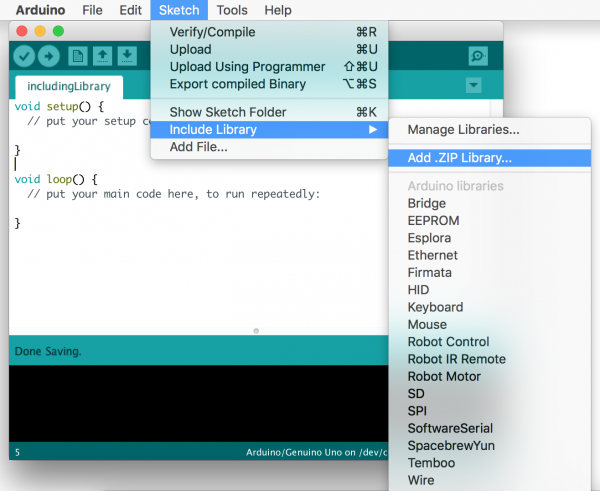
Click Sketch -> Include Library -> Manger Libraries to open the Library Manger. Once open, type “microview” in the search field. Install the SparkFun MicroView library by clicking on the library and then clicking the install button. Once installed, there should be a blue “installed” indicator next to the library.
![Library Manger]()
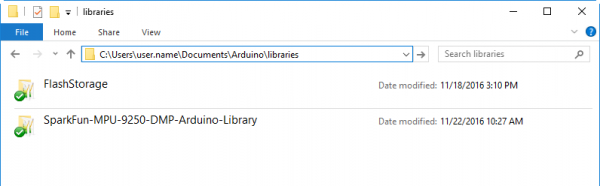
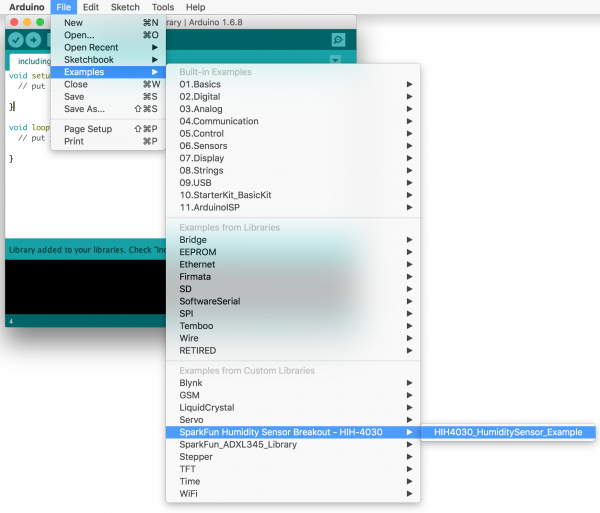
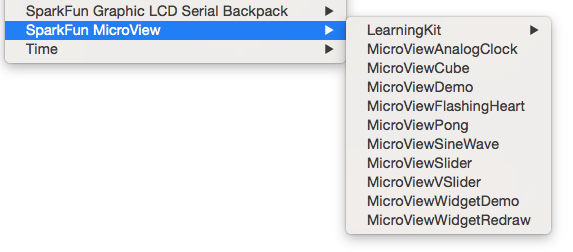
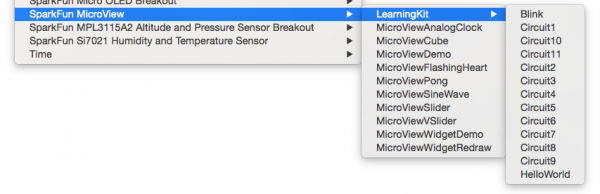
You should now be able to find all the MicroView examples in your Arduino IDE sketchbook.
![examples]()
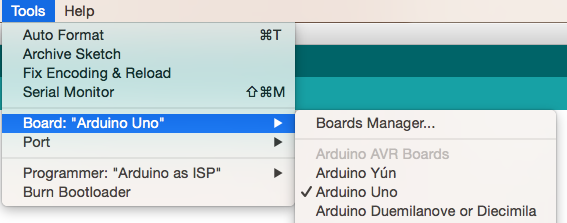
Board Selection
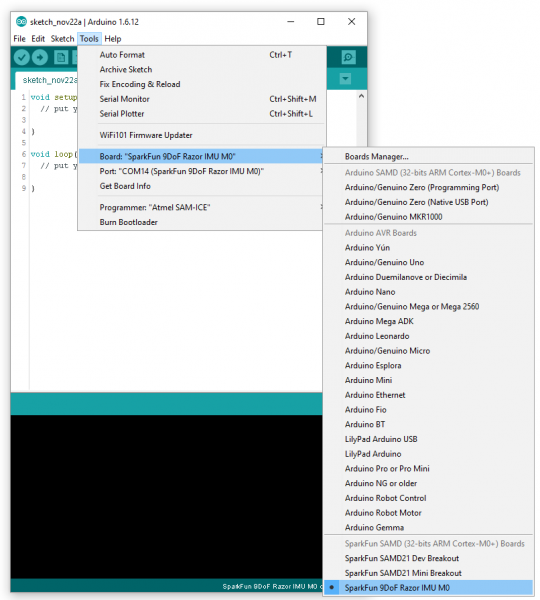
Once the Arduino IDE is up and running, you’ll need to select the correct board. Luckily, the MicroView is supported as an Arduino Uno variant, meaning no extra .brd files need to be installed to use the MicroView. Select Arduino Uno under Tools -> Boards.
![board selection]()
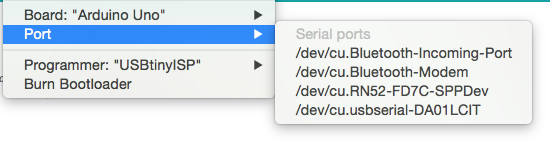
In the Arduino IDE under Tools -> Ports, select the correct COM port. This is the port that was found in the Driver Installation section.
![alt text]()
For advanced users who like to see MicroView as a board by itself in the IDE, add the following board definition to the boards.txt file. Depending on your setup, the boards.txt file is usually located in the arduino-version\hardware\arduino folder. Replace arduino-version with the right folder name for the Arduino version installed in your computer.
uview.upload.tool=avrdude
uview.bootloader.tool=avrdude
uview.name=MicroView
uview.upload.protocol=arduino
uview.upload.maximum_size=32256
uview.upload.speed=115200
uview.bootloader.low_fuses=0xff
uview.bootloader.high_fuses=0xde
uview.bootloader.extended_fuses=0x05
uview.bootloader.path=optiboot
uview.bootloader.file=optiboot_atmega328.hex
uview.bootloader.unlock_bits=0x3F
uview.bootloader.lock_bits=0x0F
uview.build.mcu=atmega328p
uview.build.f_cpu=16000000L
uview.build.core=arduino
uview.build.variant=standard
With the drivers and library installed and the correct settings selected in the Arduino IDE, it’s time to run our first program on the MicroView. The “Hello, World” sketch in the next section will be the first code we upload to the MicroView.
Example 1 - Hello, World!
The “Hello, World” sketch is common for programming of all types. For most embedded electronics, blinking an LED is the equivalent of printing out a “Hello, World” string. However, since the MicroView has its own display, we can actually print “Hello, World” to the screen as our first program.
Copy the following code, paste it into the Arduino IDE and click upload. Alternatively, you can open the HelloWorld sketch found under File -> Examples -> SparkFun MicroView -> Learning Kit -> HelloWorld.
language:c
#include <MicroView.h>

void setup() {
    uView.begin();              // start MicroView
    uView.clear(PAGE);          // clear page
    uView.print("Hello, World!");   // display string
    uView.display();
}

void loop () {}
Once uploaded, you should see “Hello, World” print out on the OLED screen.
Congratulations! You just uploaded your first MicroView sketch!
Let’s see what else we can program.
Example 2 - Basic Drawing
In this example, we’re going to try some basic drawing. This sketch demonstrates the MicroView’s many drawing functions, including pixels, lines, circles and rectangles.
It also introduces the setCursor() function, which allows you to move the cursor and print text or draw shapes at different locations other than the origin (0,0).
Copy the following code, paste it into the Arduino IDE and click upload.
language:c
#include <MicroView.h>

void setup() {
    uView.begin();
    uView.clear(PAGE);      // clear the page buffer
}

void loop() {
    uView.line(0,0,64,48);
    uView.circle(32,24,10);
    uView.rect(10,10,20,20);
    uView.pixel(50,5);
    uView.setCursor(0,40);
    uView.print(" MicroView");
    uView.display();        // display current page buffer
}
Once uploaded, you should see various images appear on the display.
Check out the MicroView Class Reference page for more information on drawing.
This example introduces one of the MicroView’s most powerful programming tools: the widget. This sketch uses both the MicroViewSlider and the MicroViewGauge. These widgets are useful for displaying information from sensors, timers or other hardware, such as buttons or knobs.
Copy the following code, paste it into the Arduino IDE and click upload.
language:c
#include <MicroView.h>

MicroViewWidget *widget,*widget2;

void setup() {
    uView.begin();
    uView.clear(PAGE);
    widget= new MicroViewGauge(32,30,0,100);// draw Gauge widget at x=32,y=30,min=0, max=100
    widget2= new MicroViewSlider(0,0,0,100);// draw Slider widget at x=0,y=0,min=0, max=100
}

void loop() {
    for(int i=0; i<=100;i++) {
        widget->setValue(i);    // give a value to widget
        widget2->setValue(i);
        uView.display();        // display current page buffer
    }
}
Once uploaded, you should see a slider widget and a gauge widget run through the values 0–100 in a repeated loop.
Check out the MicroView Class Reference page for more information on widgets.
Example 4 - Drawing Bitmaps
This last example shows how to draw bitmap images to the MicroView. This is useful for creating splash screens of company logos, making sprites or just creating fun graphics for displaying information.
Before we can call the drawBitmap() function, we first need an image to draw. Remember, the screen resolution on the MicroView is 64x48 pixels, so images larger than that will not display correctly. To get a correctly sized image, there are a few methods:
- Create a blank image in your favorite drawing program (Inkscape, Photoshop, Paint, etc.), setting the canvas size to 64x48 pixels. You can then draw your image by hand.
- Find an appropriately sized image on the Internet.
- Use a program to take an image and convert it to a bitmap.
Detailed instruction on how to make bitmap images is beyond the scope of this tutorial.
Once you have a bitmap, it’s time to convert it into an array that the MicroView can understand. You can use programs such as LCD Assitant (Windows only) or this homebrew conversion program (any OS that runs processing), created by SparkFun customer George Beckstein to convert your image into an array. With your array created, paste it into your code. Be sure to name it appropriately. Then call your array inside the drawBitmap() function.
language:c
#include <MicroView.h>


//------------------------------------------------------------------------------
// File generated by LCD Assistant
// http://en.radzio.dxp.pl/bitmap_converter/
//------------------------------------------------------------------------------
//This is the array that holds the Bitmap image. The easiest way to convert a bmp
//to an array is to use the LCD Assistant linked above.
uint8_t bender [] = {
0xFF, 0xFF, 0xFF, 0xFF, 0xFF, 0xFF, 0xFF, 0xFF, 0xFF, 0x7F, 0xBF, 0xDF, 0x5F, 0x5F, 0x5F, 0x5F,
0x5F, 0x5F, 0x5F, 0x5F, 0x5F, 0x5F, 0x5F, 0x5F, 0x5F, 0x5F, 0x5F, 0x5F, 0x5F, 0x5F, 0x5F, 0x5F,
0x5F, 0x5F, 0x5F, 0x5F, 0x5F, 0x5F, 0x5F, 0x5F, 0x5F, 0x5F, 0x5F, 0x5F, 0x5F, 0x5F, 0x5F, 0x5F,
0x5F, 0xDF, 0xBF, 0x7F, 0xFF, 0xFF, 0xFF, 0xFF, 0xFF, 0xFF, 0xFF, 0xFF, 0xFF, 0xFF, 0xFF, 0xFF,
0xFF, 0xFF, 0xFF, 0xFF, 0xFF, 0xFF, 0x07, 0xF9, 0xFE, 0x07, 0x01, 0x00, 0x00, 0xF8, 0xFE, 0xFF,
0xFF, 0xFF, 0x1F, 0x1F, 0x1F, 0xFF, 0xFF, 0xFE, 0xFC, 0xF8, 0xF0, 0xE0, 0x00, 0x00, 0x00, 0x00,
0xE0, 0xF0, 0xF8, 0xFC, 0xFE, 0xFF, 0xFF, 0x1F, 0x1F, 0x1F, 0xFF, 0xFF, 0xFF, 0xFF, 0xFE, 0xF8,
0x00, 0x00, 0x01, 0x07, 0xFE, 0xF9, 0x07, 0xFF, 0xFF, 0xFF, 0xFF, 0xFF, 0xFF, 0xFF, 0xFF, 0xFF,
0xFF, 0xFF, 0xFF, 0xFF, 0xFF, 0xFF, 0xFE, 0xF9, 0xE7, 0xDC, 0xB0, 0xA0, 0x40, 0x41, 0x47, 0x4F,
0x5F, 0x5F, 0x5F, 0x5F, 0x5F, 0x5F, 0x5F, 0x5F, 0x5F, 0x4F, 0x47, 0x43, 0x40, 0x40, 0x40, 0x40,
0x43, 0x47, 0x4F, 0x5F, 0x5F, 0x5F, 0x5F, 0x5F, 0x5F, 0x5F, 0x5F, 0x5F, 0x4F, 0x47, 0x43, 0x40,
0x40, 0xA0, 0xB0, 0xDE, 0xE7, 0xF9, 0xFE, 0x1F, 0x0F, 0x07, 0x73, 0x79, 0xFF, 0xFF, 0xFF, 0xFF,
0xFF, 0xFF, 0xFF, 0xFF, 0xFF, 0xFF, 0xFF, 0xFF, 0xFF, 0xFF, 0xFF, 0xFF, 0xFF, 0xFF, 0xFF, 0x7F,
0xBF, 0x5F, 0xEF, 0x0F, 0xEF, 0xEF, 0xDF, 0xDF, 0x1F, 0xDF, 0xDF, 0xDF, 0xDF, 0x1F, 0xDF, 0xDF,
0xDF, 0xDF, 0xDF, 0x1F, 0xDF, 0xDF, 0xDF, 0xEF, 0x0F, 0xEF, 0xDF, 0xBF, 0x7F, 0xFF, 0xFF, 0xFF,
0x7F, 0x7F, 0x7F, 0x7F, 0x7F, 0xFF, 0xFF, 0xFF, 0xBE, 0x9C, 0xC0, 0xE0, 0xF0, 0xF9, 0xFF, 0xFF,
0xFF, 0xFF, 0xFF, 0xFF, 0xFF, 0xFF, 0xFF, 0xFF, 0xFF, 0xFF, 0xFF, 0xFF, 0xFF, 0xFF, 0xFF, 0xC0,
0xB7, 0x6F, 0xEE, 0x00, 0xDE, 0xDE, 0xDE, 0xDD, 0x00, 0xDD, 0xDD, 0xDD, 0xDD, 0x00, 0xDD, 0xDD,
0xDD, 0xC5, 0xC1, 0x00, 0xC9, 0xC5, 0xC1, 0x01, 0xC8, 0xC4, 0x42, 0x80, 0xC0, 0xE8, 0xE4, 0xE2,
0xE0, 0xE0, 0xEF, 0xEF, 0xE6, 0xF0, 0xFF, 0xFF, 0xFF, 0xFF, 0xFF, 0xFF, 0xFF, 0xFF, 0xFF, 0xFF,
0xFF, 0xFF, 0xFF, 0xFF, 0xFF, 0xFF, 0xFF, 0xFF, 0xFF, 0xFF, 0xFF, 0xFF, 0xFF, 0xFF, 0xFF, 0xFF,
0xFF, 0xFF, 0xFE, 0xFE, 0xFD, 0xFD, 0xFD, 0xFB, 0xF8, 0xFB, 0xFB, 0xFB, 0xFB, 0xF8, 0xFB, 0xFB,
0xFB, 0xFB, 0xFB, 0xF8, 0xFB, 0xFD, 0xFD, 0xFC, 0xFE, 0xFE, 0xFF, 0xFF, 0xFF, 0xFF, 0xFF, 0xFF,
0xFF, 0xFF, 0xFF, 0xFF, 0xFF, 0xFF, 0xFF, 0xFF, 0xFF, 0xFF, 0xFF, 0xFF, 0xFF, 0xFF, 0xFF, 0xFF
};


void setup() {
    uView.begin();
    uView.clear(PAGE);


    uView.drawBitmap(bender);
    uView.display();
}

void loop() {
}
Once this is uploaded, you should be greeted by a familiar fictional character.
There are several other example sketches included with the MicroView library. Try loading some of these other examples and figuring out what the code is doing.
![demo]()
OLED Memory Map
This section goes into more detail about how the OLED screen functions and how the MicroView library works with the screen’s controller. Read on to get a better understanding of how the MicroView prints and draws to the OLED screen.
The SSD1306 is the controller built into the MicroView’s OLED display. It has flexible yet complex segment and common drivers. Vast knowledge on memory addressing is required in order to use the SSD1306 controller.
MicroView’s library was written to hide away the complexities of the SSD1306 controller so that users can issue simple commands to control the display. Although the SSD1306 has a built-in RAM (memory) for the screen, when connected using the SPI method, the ATmega328P is not able to read the RAM (memory) of the SSD1306. Therefore, the software will not be able to manipulate the screen buffer to perform mathematical operations.
MicroView’s library overcomes this by allocating 384 bytes ( (64x48)/8 bits) of memory from ATmega328P as buffer. The library can now manipulate the screen buffer and then perform a bulk transfer from the ATmega328P’s memory to the internal memory of the SSD1306 controller.
The 384 bytes of screen buffer are declared in MicroView’s library as
language:c
static uint8_t screenmemory [] = {.total 384 bytes of data..};
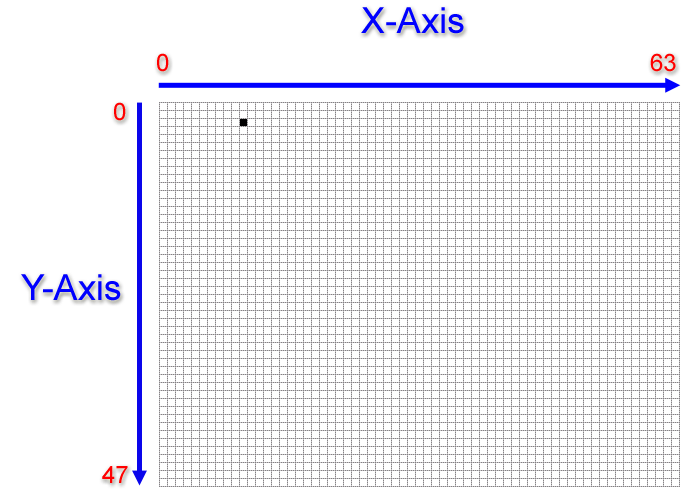
and are arranged in a linear form representing the following 64x48 pixel coordinate system.
![microview coordinates]()
Based on the above illustration, for example, if a user wished to plot a pixel at the position of the black dot, where X=10 and Y=2, the user would issue the following command:
language:c
uView.pixel(10,2);
This command would then calculate the exact location of the screen buffer and set a BIT in the corresponding BYTE to the X,Y position.
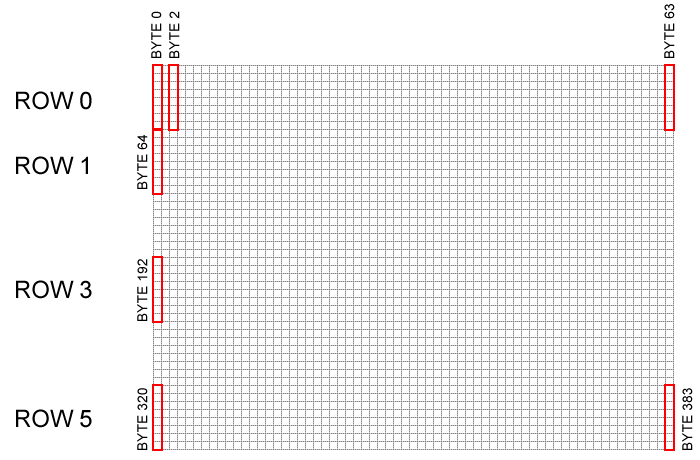
![memory map]()
Diagram showing how a linear screen buffer in the ATmega328P aligns with the OLED pixels.
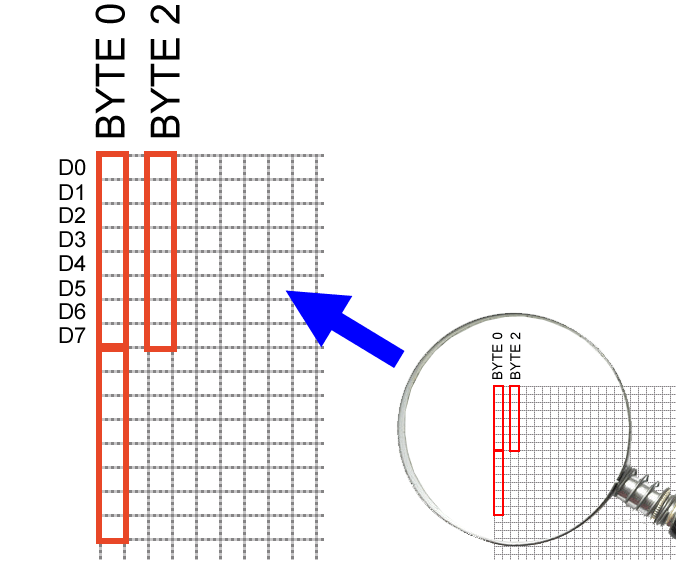
![data bits]()
Diagram showing the BITs in a BYTE of the screen buffer corresponding to the OLED’s X,Y position.
Based on the above illustration, a pixel turned on at X=2 and Y=3 means BYTE 2 of the screen buffer has data of 0x08 (hex).
Two pixels at X=2,Y=3 and X=2,Y=2 turned on means BYTE 2 of the screen buffer has data of 0x0c (hex).
The following C code shows a pixel-by-pixel way to draw a straight line of 5 pixels starting from 10,2 to 10,6.
language:c
uView.pixel(10,2);
uView.pixel(10,3);
uView.pixel(10,4);
uView.pixel(10,5);
uView.pixel(10,6);
The MicroView library allows you to draw lines by specifying the start and end coordinates. The above line could be drawn with this simple one-line command:
language:c
uView.line(10,2,10,6);
In order for the library to perform extremely fast mathematical operations on the screen buffer (more than 100 frames per second), calls to the drawing functions within the MicroView library do not immediately transfer the contents of screen buffer to the SSD1306 controller. A display() command is required to instruct the library to perform the bulk transfer from the screen buffer to the SSD1306 controller:
language:c
uView.display();
This function takes the whole screen buffer in the ATmega328P and transfers it (via SPI bus, programmed at 8Mhz) to the internal memory of the SSD1306. As soon as the memory is being transferred, the pixels corresponding to the screen buffer will show up on the OLED display.
Creating Fonts for MicroView
Though there are several different fonts that come programmed into the MicroView, you have the option to create your own fonts! Read on to find out how to do so.
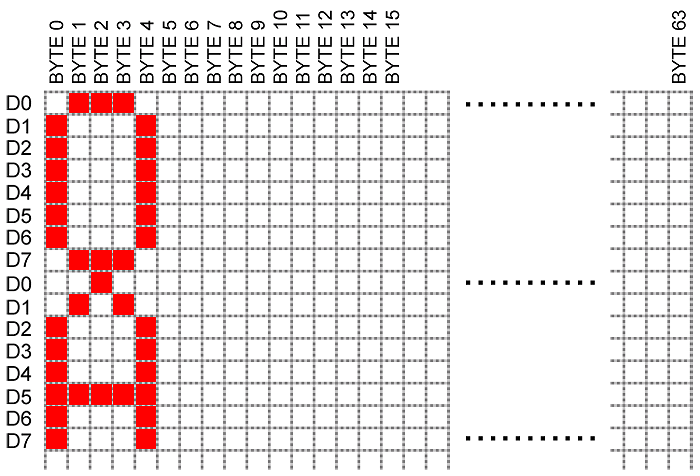
In the OLED Memory Map section, we covered how the MicroView library allocates 384 bytes of RAM as screen buffer from ATmega328P to perform graphic operations before transferring this block of memory to the SSD1306 OLED controller’s memory. The following diagram shows how two 5x8 pixel characters are drawn on the screen buffer.
![5x8 font mapping]()
From the diagram, the “O” character appeared on ROW0, and took up 5 bytes of RAM from the screen buffer in the following order:
BYTE0 = 0x7e
BYTE1 = 0x81
BYTE2 = 0x81
BYTE3 = 0x81
BYTE4 = 0x7e
Character “A,” which was shown on ROW1, took up 5 bytes of RAM from the screen buffer in the following order:
BYTE64 = 0xfc
BYTE65 = 0x22
BYTE66 = 0x21
BYTE67 = 0x22
BYTE68 = 0xfc
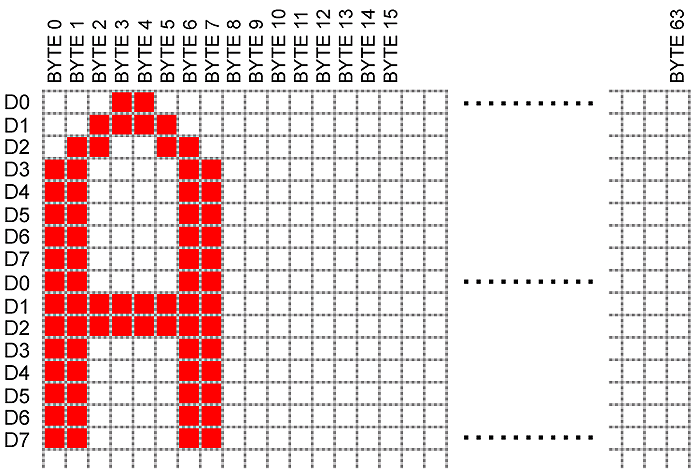
A 8x16 font will take up 16 bytes of RAM from the screen buffer as shown in the next diagram:
![8x16 font mapping]()
With the 8x16 font using RAM from screen buffer’s ROW0 and ROW1, the data of the above diagram will occupy the screen buffer’s BYTE0 – BYTE7 and BYTE64 – BYTE71.
BYTE0 = 0xf8
BYTE1 = 0xfc
BYTE2 = 0x06
BYTE3 = 0x03
BYTE4 = 0x03
BYTE5 = 0x06
BYTE6 = 0xfc
BYTE7 = 0xf8
BYTE64 = 0xff
BYTE65 = 0xff
BYTE66 = 0x06
BYTE67 = 0x06
BYTE68 = 0x06
BYTE69 = 0x06
BYTE70 = 0xff
BYTE71 = 0xff
Manually plotting fonts and text is very tedious! It’s much easier to use the font-printing functions within the MicroView library. Displaying text in MicroView is as simple as: uView.print("Hello");
Although MicroView’s library includes four different types of font, these fonts might not suit your needs. By following these steps, you can make your own fonts and include them within the MicroView library:
- Convert fonts to bitmap.
- Generate font source file from bitmap.
- Add font source file to MicroView library.
Converting Fonts to Bitmap
Once we understand how a character is being mapped to the MicroView’s screen buffer, we can choose to manually draw a font to the screen buffer or, alternatively, we can use software to convert a computer’s font to bitmap and then convert the bitmap into C char definition used by the MicroView library.
We have had good results using Codehead’s Bitmap Font Generator to convert a font into a bitmap. If you have had success with using other tools, please let us know, and we’ll update this article.
![Codehead_Bitmap_Font_Generator]()
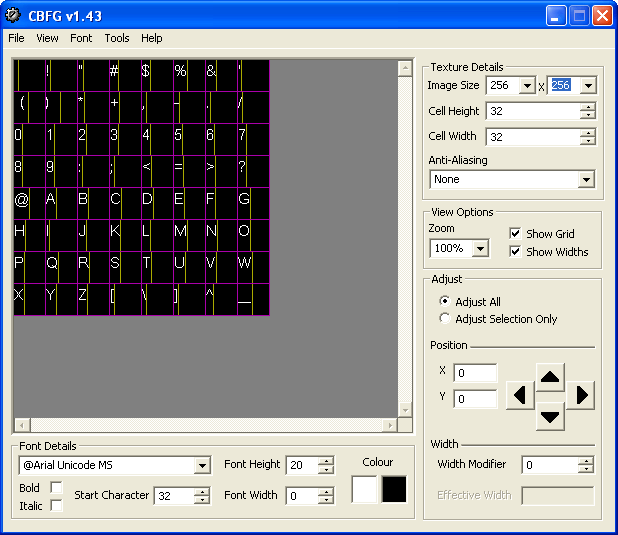
Let’s quickly run through a few simple steps to convert a computer’s font into a bitmap. Assuming we need the numbers 0 to 9 of the Courier font in 12x24 pixels, the following steps will generate the required bitmap:
- Select “Courier” from the Font Details dropdown combo box.
- Enter 48 as the Cell Height.
- Enter 12 as the Cell Width.
- Enter 128x32 as the Image Size (this Image Size need to be larger than 12x24x10(number of characters) ).
- Enter 48 as the Start Character (48 ASCII code is the number 0).
- Enter 200% as the Zoom.
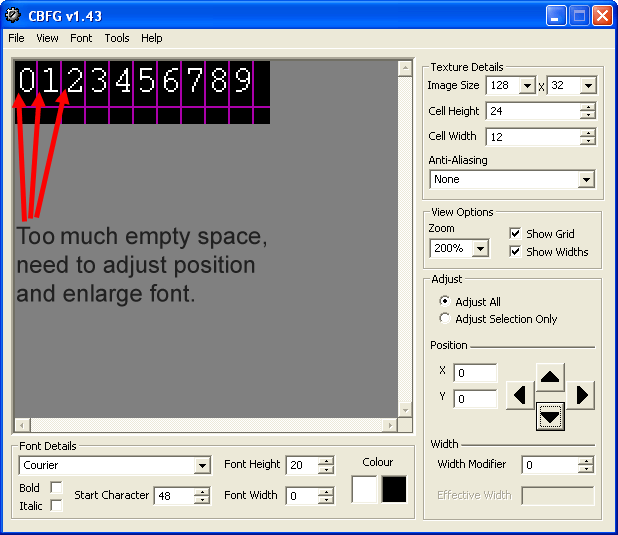
![Codehead_Too_Much_Space]()
From the generated result, it is clear that there is too much space on the left of the numbers and the glyphs are not taking full advantage of the 12x48 pixel cells.
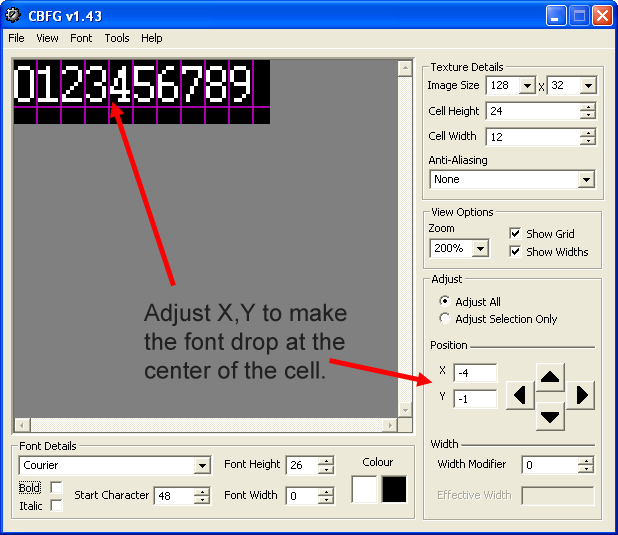
Let’s further improve the font:
- Enter or slowly increase Font Height to a suitable value—in this case, 26
- Adjust the Position (X,Y) using the arrow button with option “Adjust All” selected (in this case, X=-4, Y=-1)
After the adjustment, we should see the following result:
![Codehead_Center_Cell]()
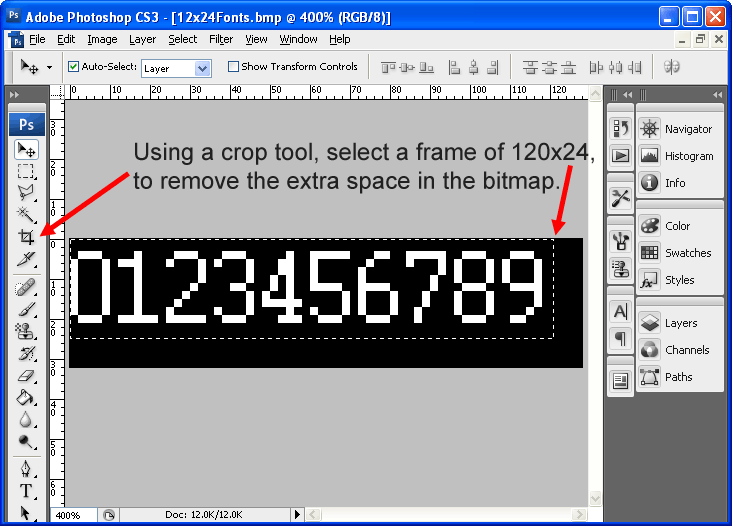
This result is almost perfect except there is still empty space on the right of the “9” glyph and at the bottom of all the numbers. We can’t further improve the font spacing in Codehead Font Generator because it doesn’t allow custom image sizes, so we’ll correct the font in an image editor later.
Click File, then Export Bitmap (BMP), save the file as 12x24Font.bmp.
Using an image editor like Photoshop or GIMP, open the 12x24Font.bmp file, then make a selection to crop a 120x24 frame from the image.
![Codehead_Crop]()
If you want a WHITE text on BLACK background, you will need to INVERT the color now.
Save the image and then proceed to next step. You can also save the hassle by downloading the 12x24Font.bmp already prepared by us.
You have now successfully created a customized bitmap font!
Generating Font Source File from Bitmap
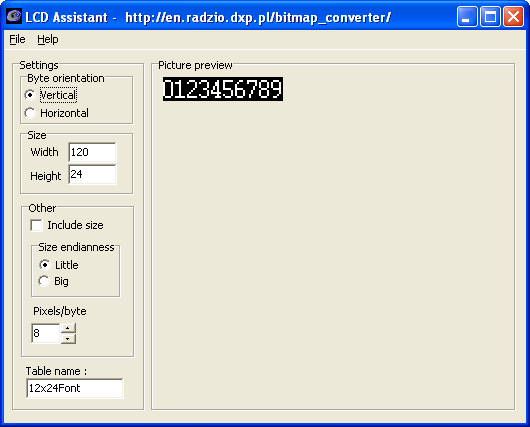
In order to convert the font from bitmap to C char definition, we will be using LCD Assistant. Run LCD Assistant and load the 12x24Font.bmp file previously saved.
![LCD_Assistant]()
Make sure that following options are correct:
- Picture preview is the right bitmap.
- Byte Orientation has Vertical selected.
- Width is 120, and Height is 24.
- Include Size not selected.
- Size Endianness has Little selected.
- Pixels/byte is 8.
- Table name is 12x14Font (can be any name).
Once all the options are correctly selected, click File, then save the output and type in the filename as 12x24Font.h.
Using a text file editor, open 12x24Font.h.
Locate
language:c
const unsigned char 12x24Font [] = {
and replace with
language:c
#ifndef FONT12X24_H
#define FONT12X24_H
#include <avr/pgmspace.h>
static const unsigned char font12x24 [] PROGMEM = {
// first row defines - FONTWIDTH, FONTHEIGHT, ASCII START CHAR, TOTAL CHARACTERS, FONT MAP WIDTH HIGH, FONT MAP WIDTH LOW (2,56 meaning 256)
    12,24,48,10,1,20,
FONT MAP WIDTH is basically the WIDTH of the BITMAP file used to generate the fonts. In this situation, the WIDTH of the BITMAP file is 120. So the HIGH number is 1, and the LOW number is 20.
Then replace
language:c
};
with
language:c
};
#endif
You should get the following result:
language:c
//------------------------------------------------------------------------------
// File generated by LCD Assistant
// http://en.radzio.dxp.pl/bitmap_converter/
//------------------------------------------------------------------------------

#ifndef FONT12X24_H
#define FONT12X24_H
#include <avr/pgmspace.h>
static const unsigned char font12x24 [] PROGMEM = {
    // first row defines - FONTWIDTH, FONTHEIGHT, ASCII START CHAR, TOTAL CHARACTERS, FONT MAP WIDTH HIGH, FONT MAP WIDTH LOW (2,56 meaning 256)
    12,24,48,10,1,20,
    0x1F, 0x1F, 0xE7, 0xE7, 0xE7, 0xE7, 0xE7, 0xE7, 0x1F, 0x1F, 0xFF, 0xFF, 0x9F, 0x9F, 0x9F, 0x9F,
    0x07, 0x07, 0xFF, 0xFF, 0xFF, 0xFF, 0xFF, 0xFF, 0x9F, 0x9F, 0xE7, 0xE7, 0xE7, 0xE7, 0xE7, 0xE7,
    0x1F, 0x1F, 0xFF, 0xFF, 0x9F, 0x9F, 0xE7, 0xE7, 0xE7, 0xE7, 0xE7, 0xE7, 0x1F, 0x1F, 0xFF, 0xFF,
    0xFF, 0xFF, 0xFF, 0xFF, 0x1F, 0x1F, 0x07, 0x07, 0xFF, 0xFF, 0xFF, 0xFF, 0x07, 0x07, 0xE7, 0xE7,
    0xE7, 0xE7, 0xE7, 0xE7, 0xE7, 0xE7, 0xFF, 0xFF, 0x7F, 0x7F, 0x9F, 0x9F, 0xE7, 0xE7, 0xE7, 0xE7,
    0xFF, 0xFF, 0xFF, 0xFF, 0x87, 0x87, 0xE7, 0xE7, 0xE7, 0xE7, 0xE7, 0xE7, 0x07, 0x07, 0xFF, 0xFF,
    0x1F, 0x1F, 0xE7, 0xE7, 0xE7, 0xE7, 0xE7, 0xE7, 0x1F, 0x1F, 0xFF, 0xFF, 0x1F, 0x1F, 0xE7, 0xE7,
    0xE7, 0xE7, 0xE7, 0xE7, 0x1F, 0x1F, 0xFF, 0xFF, 0x00, 0x00, 0xFF, 0xFF, 0xFF, 0xFF, 0xFF, 0xFF,
    0x00, 0x00, 0xFF, 0xFF, 0xFF, 0xFF, 0xFF, 0xFF, 0x00, 0x00, 0xFF, 0xFF, 0xFF, 0xFF, 0xFF, 0xFF,
    0xFF, 0xFF, 0x7F, 0x7F, 0x9F, 0x9F, 0xE7, 0xE7, 0xF8, 0xF8, 0xFF, 0xFF, 0xFF, 0xFF, 0xFF, 0xFF,
    0xE7, 0xE7, 0xE7, 0xE7, 0x18, 0x18, 0xFF, 0xFF, 0x1F, 0x1F, 0x61, 0x61, 0x7E, 0x7E, 0x00, 0x00,
    0x7F, 0x7F, 0xFF, 0xFF, 0xE0, 0xE0, 0xE7, 0xE7, 0xE7, 0xE7, 0xE7, 0xE7, 0x1F, 0x1F, 0xFF, 0xFF,
    0x00, 0x00, 0xE7, 0xE7, 0xE7, 0xE7, 0xE7, 0xE7, 0x1F, 0x1F, 0xFF, 0xFF, 0xFF, 0xFF, 0xFF, 0xFF,
    0x1F, 0x1F, 0xE1, 0xE1, 0xFE, 0xFE, 0xFF, 0xFF, 0x18, 0x18, 0xE7, 0xE7, 0xE7, 0xE7, 0xE7, 0xE7,
    0x18, 0x18, 0xFF, 0xFF, 0xF8, 0xF8, 0xE7, 0xE7, 0xE7, 0xE7, 0xE7, 0xE7, 0x00, 0x00, 0xFF, 0xFF,
    0xF8, 0xF8, 0xE7, 0xE7, 0xE7, 0xE7, 0xE7, 0xE7, 0xF8, 0xF8, 0xFF, 0xFF, 0xE7, 0xE7, 0xE7, 0xE7,
    0xE0, 0xE0, 0xE7, 0xE7, 0xE7, 0xE7, 0xFF, 0xFF, 0xE1, 0xE1, 0xE6, 0xE6, 0xE7, 0xE7, 0xE7, 0xE7,
    0xE7, 0xE7, 0xFF, 0xFF, 0xF9, 0xF9, 0xE7, 0xE7, 0xE7, 0xE7, 0xE7, 0xE7, 0xF8, 0xF8, 0xFF, 0xFF,
    0xFE, 0xFE, 0xFE, 0xFE, 0xE6, 0xE6, 0xE0, 0xE0, 0xE6, 0xE6, 0xFF, 0xFF, 0xF9, 0xF9, 0xE7, 0xE7,
    0xE7, 0xE7, 0xE7, 0xE7, 0xF8, 0xF8, 0xFF, 0xFF, 0xF8, 0xF8, 0xE7, 0xE7, 0xE7, 0xE7, 0xE7, 0xE7,
    0xF8, 0xF8, 0xFF, 0xFF, 0xFF, 0xFF, 0xE1, 0xE1, 0xFE, 0xFE, 0xFF, 0xFF, 0xFF, 0xFF, 0xFF, 0xFF,
    0xF8, 0xF8, 0xE7, 0xE7, 0xE7, 0xE7, 0xE7, 0xE7, 0xF8, 0xF8, 0xFF, 0xFF, 0xFF, 0xFF, 0xE7, 0xE7,
    0xE7, 0xE7, 0xF9, 0xF9, 0xFE, 0xFE, 0xFF, 0xFF,
};
#endif
You have now successfully converted the bitmap font to a C header file!
Adding the Font Source File to MicroView Library
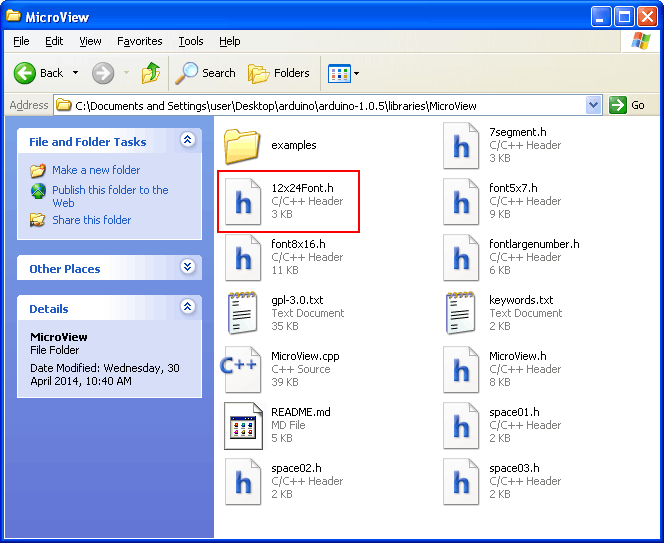
Move the edited 12x24Font.h file to MicroView’s library folder. You should be able to see the 12x24Font.h in the same folder as the rest of the MicroView’s files.
![Move_Font_To_Library]()
Using a text file editor, open MicroView.cpp, and perform the following steps:
Locate
language:c
// Add header of the fonts here.  Remove as many as possible to conserve FLASH memory.
Add after this line
language:c
#include <12x24Font.h>
Locate
language:c
// Change the total fonts included
#define TOTALFONTS      7
Change to
language:c
// Change the total fonts included
#define TOTALFONTS      8
Locate
language:c
const unsigned char *MicroView::fontsPointer[]={
    font5x7
    ,font8x16
    ,sevensegment
    ,fontlargenumber
    ,space01
    ,space02
    ,space03
};
Change to
language:c
const unsigned char *MicroView::fontsPointer[]={
    font5x7
    ,font8x16
    ,sevensegment
    ,fontlargenumber
    ,space01
    ,space02
    ,space03
    ,font12x24
};
The font that we have just added is at the 7th position starting from position 0 (font5x7) in the MicroView::fontsPointer array; therefore, the new font is now fontType 7. Save MicroView.cpp once you have made your changes.
Run the following sketch to test your new font:
language:c
#include <MicroView.h>

void setup() {
  uView.begin();
  uView.clear(PAGE);
  uView.setFontType(7);
  uView.print("1234");
  uView.display();
}

void loop () {
}
You have now successfully hacked MicroView’s library to add your own custom font!
MicroView Class Reference
Below you will find a complete list of available MicroView classes that can be called in your code.
Initialization
void begin(void)—Initialization of MicroView Library.Setup IO pins for SPI port then send initialization commands to the SSD1306 controller inside the OLED.
void end (void)—Power off the OLED display. Reset display control signals and prepare the SSD1306 controller for power off, then power off the 3.3V regulator.
Display Actions, Settings and Orientation
void display(void)—Transfer display memory. Bulk move the screen buffer to the SSD1306 controller’s memory so that images/graphics drawn on the screen buffer will be displayed on the OLED.
void clear(* uint8_t mode)—Clear screen buffer or SSD1306’s memory. To clear GDRAM inside the LCD controller, pass in the variable mode = ALL and to clear screen page buffer pass in the variable mode = PAGE.
void clear(* uint8_t mode, * uint8_t c)—Clear or replace screen buffer or SSD1306’s memory with a character. To clear GDRAM inside the LCD controller, pass in the variable mode = ALL with c character and to clear screen page buffer, pass in the variable mode = PAGE with c character.
void invert(boolean inv)—Invert display. The WHITE color of the display will turn to BLACK, and the BLACK will turn to WHITE.
void contrast(* uint8_t contrast)—Set contrast. OLED contrast value from 0 to 255. Note: Contrast level is not very obvious.
void setCursor(* uint8_t x, * uint8_t y)—Set cursor position. MicroView’s cursor position to x,y.
void flipVertical(boolean flip)—Vertical flip. Flip the graphics on the OLED vertically.
void flipHorizontal(boolean flip)—Horizontal flip. Flip the graphics on the OLED horizontally.
uint8_t getLCDWidth(void)—The width of the LCD return as byte.
uint8_t getLCDHeight(void)—The height of the LCD return as byte.
Display Scrolling
void scrollRight(* uint8_t start, * uint8_t stop)—Right scrolling. Set row start to row stop on the OLED to scroll right. Refer to OLED Memory Map section for explanation of the rows.
void scrollLeft(* uint8_t start, * uint8_t stop)—Left scrolling. Set row start to row stop on the OLED to scroll left. Refer to OLED Memory Map section for explanation of the rows.
void scrollVertRight(* uint8_t start, * uint8_t stop)—Right vertical scrolling. Set column start to row stop on the OLED to scroll right. Refer to OLED Memory Map section for explanation of the columns.
void scrollVertLeft(* uint8_t start, * uint8_t stop)—Left vertical scrolling. Set column start to row stop on the OLED to scroll left. Refer to OLED Memory Map section for explanation of the columns.
void scrollStop(void)—Stop the scrolling of graphics on the OLED.
Font Functions
uint8_t getFontWidth(void)—Get font width. The current font’s width return as byte.
uint8_t getFontHeight(void)—Get font height. The current font’s height return as byte.
uint8_t getTotalFonts(void)—Get total fonts. Return the total number of fonts loaded into the MicroView’s flash memory.
uint8_t getFontType(void)—Get font type. Return the font type number of the current font.
uint8_t setFontType(* uint8_t type)—Set font type. Set the current font type number (i.e., changing to different fonts based on the type provided).
uint8_t getFontStartChar(void)—Get font starting character. Return the starting ASCII character of the current font; not all fonts start with ASCII character 0. Custom fonts can start from any ASCII character.
uint8_t getFontTotalChar(void)—Get font total characters. Return the total characters of the current font.
Drawing Pixels
void pixel(* uint8_t x, * uint8_t y)—Draw pixel. Draw pixel using the current fore color and current draw mode in the screen buffer’s x,y position.
void pixel(* uint8_t x, * uint8_t y, * uint8_t color, * uint8_t mode)—Draw pixel with color and mode. Draw color pixel in the screen buffer’s x,y position with NORM or XOR draw mode.
Drawing Lines
void line(* uint8_t x0, * uint8_t y0, * uint8_t x1, * uint8_t y1)—Draw line using current fore color and current draw mode from x0,y0 to x1,y1 of the screen buffer.
void line(* uint8_t x0, * uint8_t y0, * uint8_t x1, * uint8_t y1, * uint8_t color, * uint8_t mode)—Draw line using color and mode from x0,y0 to x1,y1 of the screen buffer.
void lineH(* uint8_t x, * uint8_t y, * uint8_t width)—Draw horizontal line using current fore color and current draw mode from x,y to x+width,y of the screen buffer.
void lineH(* uint8_t x, * uint8_t y, * uint8_t width, * uint8_t color, * uint8_t mode)—Draw horizontal line using color and mode from x,y to x+width,y of the screen buffer.
void lineV(* uint8_t x, * uint8_t y, * uint8_t height)—Draw vertical line using current fore color and current draw mode from x,y to x,y+height of the screen buffer.
void lineV(* uint8_t x, * uint8_t y, * uint8_t height, * uint8_t color, * uint8_t mode)—Draw vertical line using color and mode from x,y to x,y+height of the screen buffer.
Drawing Rectangles
void rect(* uint8_t x, * uint8_t y, * uint8_t width, * uint8_t height)—Draw rectangle using current fore color and current draw mode from x,y to x+width,y+height of the screen buffer.
void rect(* uint8_t x, * uint8_t y, * uint8_t width, * uint8_t height, * uint8_t color, * uint8_t mode)—Draw rectangle using color and mode from x,y to x+width,y+height of the screen buffer.
void rectFill(* uint8_t x, * uint8_t y, * uint8_t width, * uint8_t height)—Draw filled rectangle using current fore color and current draw mode from x,y to x+width,y+height of the screen buffer.
void rectFill(* uint8_t x, * uint8_t y, * uint8_t width, * uint8_t height, * uint8_t color, * uint8_t mode)—Draw filled rectangle using color and mode from x,y to x+width,y+height of the screen buffer.
Drawing Circles
void circle(* uint8_t x, * uint8_t y, * uint8_t radius)—Draw circle with radius using current fore color and current draw mode at x,y of the screen buffer.
void circle(* uint8_t x, * uint8_t y, * uint8_t radius, * uint8_t color, * uint8_t mode)—Draw circle with radius using color and mode at x,y of the screen buffer.
void circleFill(* uint8_t x0, * uint8_t y0, * uint8_t radius)—Draw filled circle with radius using current fore color and current draw mode at x,y of the screen buffer.
void circleFill(* uint8_t x0, * uint8_t y0, * uint8_t radius, * uint8_t color, * uint8_t mode)—Draw filled circle with radius using color and mode at x,y of the screen buffer. Uses the Bresenham circle algorithm with a few modifications to paint the circle without overlapping draw operations.
MISC Drawing
void drawChar(* uint8_t x, * uint8_t y, * uint8_t c)—Draw character c using current color and current draw mode at x,y.
void drawChar(* uint8_t x, * uint8_t y, * uint8_t c, * uint8_t color, * uint8_t mode)—Draw character c using color and draw mode at x,y.
void drawBitmap(void)—Draw bitmap image stored elsewhere in the program to the OLED screen.
void setColor(* uint8_t color)—Set the current draw’s color. Only WHITE and BLACK available.
void setDrawMode(* uint8_t mode)—Set current draw mode with NORM or XOR.
MicroViewWidget
MicroViewWidget(uint8_t newx, uint8_t newy, int16_t min, int16_t max)—MicroView widget parent class. The MicroViewWidget class is the parent class for child widget like MicroViewSlider and MicroViewGauge.
uint8_t getX()—Get widget x position.
uint8_t getY()—Get widget y position.
void setX(uint8_t newx)—Set widget x position.
void setY(uint8_t newy)—Set widget y position.
int16_t getMinValue()—Return the minimum value of the widget.
int16_t getMaxValue()—Return the maximum value of the widget.
int16_t getValue()—Return the current value of the widget.
void setMinValue(int16_t min)—Set minimum value. The minimum value of the widget is set to the variable passed in.
void setMaxValue(int16_t max)—Set maximum value. The maximum value of the widget is set to the variable passed in.
void setValue(int16_t val)—The current value of the widget is set to the variable passed in, and the widget is drawn with the new value.
void setValue(int16_t val, boolean doDraw)—The current value of the widget is set to the variable passed in. The widget is drawn with the new value if the doDraw argument is true.
uint8_t getValLen()—Return the number of characters that would be printed using uView.print(value) for the current value.
uint8_t getMaxValLen()—Return the maximum number of characters that would be printed using uView.print(value) for the current value range.
virtual void draw()—Draw widget value overridden by child class.
virtual void drawFace()—Draw widget face overridden by child class.
void reDraw()—MicroView Widget reDraw routine. Redraws the widget.
void drawNumValue(int16_t value)—Draw a signed decimal numeric value at the current cursor location. The value is right justified with leading spaces, within a field the length of the maximum possible for the widget’s value range.
MicroViewGauge
MicroViewGauge(uint8_t newx, uint8_t newy, int16_t min, int16_t max)—MicroViewGauge class initialization. Initialize the MicroViewGauge widget with default style.
MicroViewGauge(uint8_t newx, uint8_t newy, int16_t min, int16_t max, uint8_t sty)—Initialize the MicroViewGauge widget with style WIDGETSTYLE0 or WIDGETSTYLE1. Add WIDGETNOVALUE to the style to suppress displaying the numeric value (e.g., WIDGETSTYLE0 + WIDGETNOVALUE).
void draw(void)—Draw widget value. Convert the current value of the widget and draw the ticker representing the value.
void drawFace(void)—Draw widget face. Draw image/diagram representing the widget’s face.
MicroViewSlider
MicroViewSlider(uint8_t newx, uint8_t newy, int16_t min, int16_t max)—MicroViewSlider class initialization. Initialize the MicroViewSlider widget with default style.
MicroViewSlider(uint8_t newx, uint8_t newy, int16_t min, int16_t max, uint8_t sty)—Initialize the MicroViewSlider widget with style WIDGETSTYLE0 or WIDGETSTYLE1 or WIDGETSTYLE2 (like 0, but vertical) or WIDGETSTYLE3 (like 1, but vertical). Add WIDGETNOVALUE to the style to suppress displaying the numeric value (e.g., WIDGETSTYLE0 + WIDGETNOVALUE).
void draw(void)—Draw widget value. Convert the current value of the widget and draw the ticker representing the value.
void drawFace(void)—Draw widget face. Draw image/diagram representing the widget’s face.
MISC Under-the-Hood Functions
void checkComm(void)—Listen for serial command. Instruct the MicroView to check for serial command from the UART.
virtual size_t write(* uint8_t)—Override Arduino’s Print. Arduino’s print overridden so that we can use uView.print().
void data(* uint8_t c)—SPI data. Send 1 data byte via SPI to SSD1306 controller.
void setColumnAddress(* uint8_t add)—Set SSD1306 column address. Send column address command and address to the SSD1306 OLED controller.
void setPageAddress(* uint8_t add)—Set SSD1306 page address. Send page address command and address to the SSD1306 OLED controller.
void doCmd(* uint8_t index)—Parse command. Command stored in serCmd array will be parsed to performed draw functions.
void command(* uint8_t c)—Send 1 command byte.
void command(* uint8_t c1, * uint8_t c2)—Send 2 command bytes.
void command(* uint8_t c1, * uint8_t c2, * uint8_t c3)—Send 3 command bytes.
uint8_t * getScreenBuffer(void)—Get pointer to screen buffer. Return a pointer to the start of the RAM screen buffer for direct access.
MVSPIClass Reference (MicroView SPI)
static void begin()—SPI Initialization. Set up SCK, MOSI, SS and DC pins for SPI transmission.
static void end()—End SPI.
static void wait()—Wait for SPI serial transfer complete.
static void transfer(byte _data)—Transfer data byte via SPI port.
static void packetBegin()—Set up to begin a SPI packet transmit. Set up SPI for transmitting. Prepare the SPI interface for transmitting 1 or more bytes of commands and/or data.
static void packetEnd()—End an SPI packet transmission:
- Wait for the last byte to finish being transmitted.
- Set DC to command mode (even if already set that way, just in case).
- Set SS high.
- Disable SPI mode (causing SCK and MOSI to go low).
static void attachInterrupt()
static void detachInterrupt()
static void setBitOrder(uint8_t)—Set SPI port bit order with LSBFIRST or MSBFIRST.
static void setDataMode(uint8_t)—Set the SPI data mode: clock polarity and phase. mode - SPI_MODE0, SPI_MODE1, SPI_MODE2, SPI_MODE3.
static void setClockDivider(uint8_t)—Set the clock divider of the SPI; default is 4Mhz.
- rate: SPI_CLOCK_DIV2 SPI_CLOCK_DIV4 SPI_CLOCK_DIV8 SPI_CLOCK_DIV16 SPI_CLOCK_DIV32 SPI_CLOCK_DIV64 SPI_CLOCK_DIV128
Resources and Going Further
Check the links below for more information about the MicroView.
Now that you have a basic understanding of how the MicroView works, what will you create? Need some inspiration?
Learn the ins and outs of electronics using the MicroView with the SparkFun Inventor’s Kit for MicroView.
SparkFun Inventor's Kit for MicroView
The SparkFun Inventor's Kit for MicroView follows our tried and true inventor's kit model, bringing you 11 simple yet fun experiments to introduce you to the SparkFun MicroView.
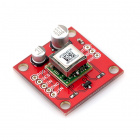
Build your own digital compass that displays the current heading on the MicroView.
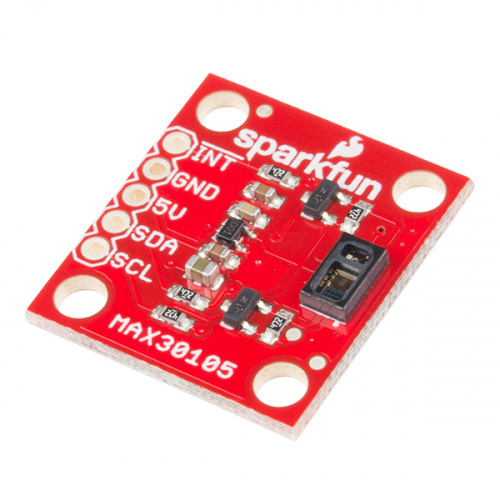
MicroView Digital Compass
Build a portable digital compass using the SparkFun MicroView and the MAG3110 Magnetometer Breakout.
learn.sparkfun.com |CC BY-SA 3.0
| SparkFun Electronics | Niwot, Colorado